Method

What Matters in Unsupervised Optical Flow [UFlow]
https://github.com/google-research/google-research/tree/master/uflow

Submitted on 5 Mar. 2020 22:43 by
Rico Jonschkowski (Robotics at Google)

Running time:0.02 s
Environment:GPU @ 3.0 Ghz (Python)

Method Description:
We systematically compare and analyze a set of
key components in unsupervised optical flow to
identify which photometric loss, occlusion
handling, and smoothness regularization is most
effective. Alongside this investigation we
construct a number of novel improvements to
unsupervised flow models, such as cost volume
normalization, stopping the gradient at the
occlusion mask, encouraging smoothness before
upsampling the flow field, and continual self-
supervision with image resizing.
Parameters:
All parameters are listed in the paper.
Latex Bibtex:
@inproceedings{jonschkowski2020matters,
title={What Matters in Unsupervised Optical
Flow},
author={Rico Jonschkowski and Austin Stone and
Jonathan T. Barron and Ariel Gordon and Kurt
Konolige and Anelia Angelova},
booktitle={ECCV},
year={2020},
}

Detailed Results

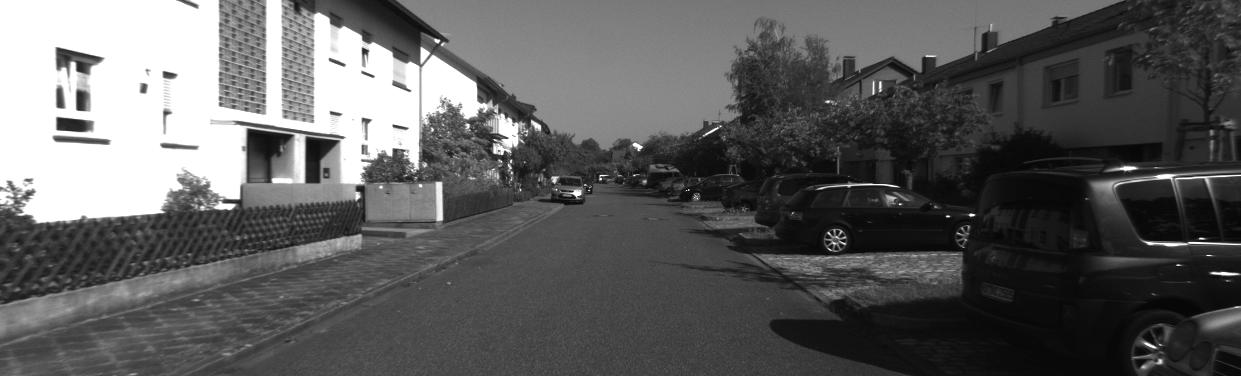
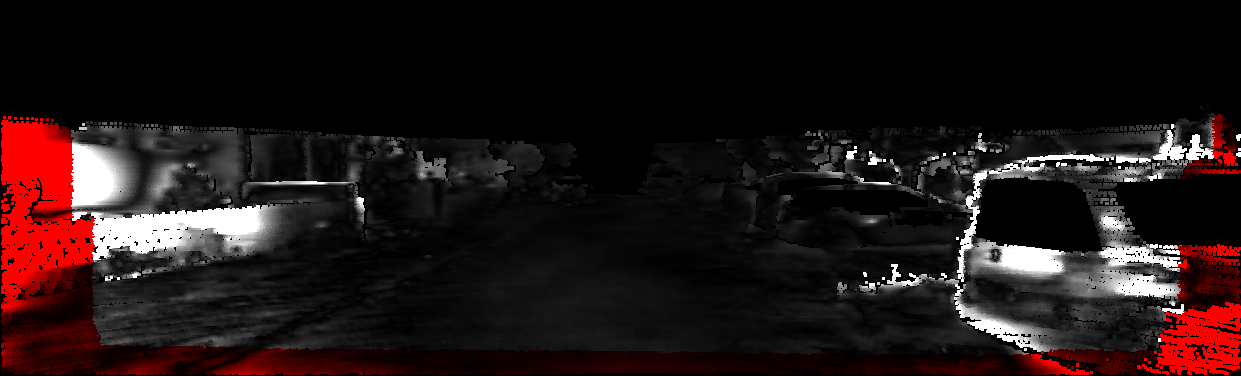
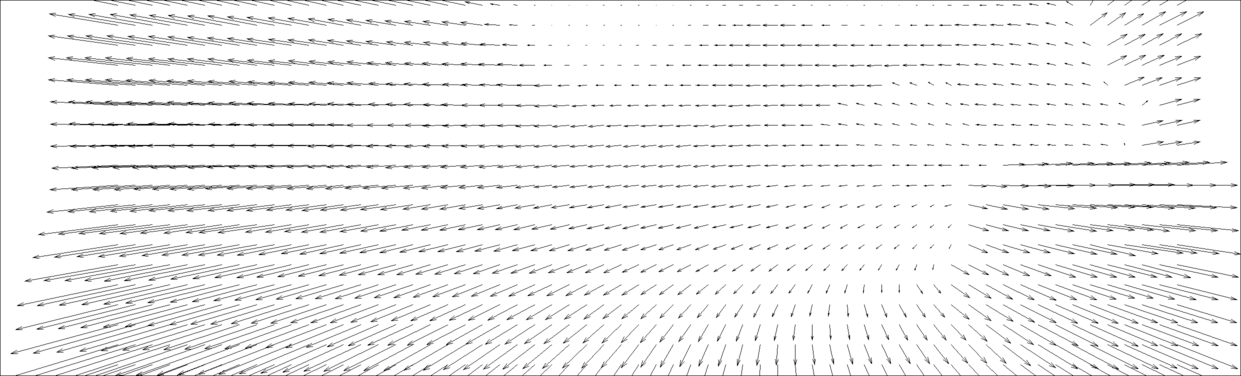
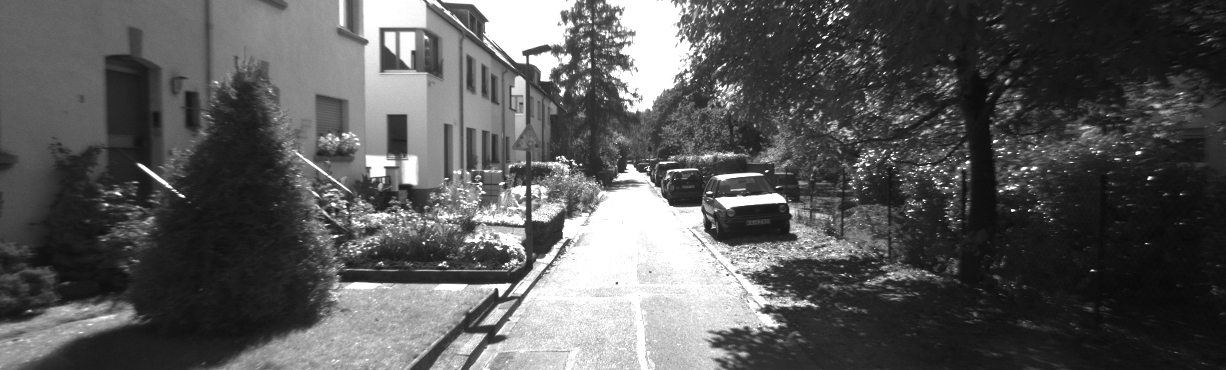
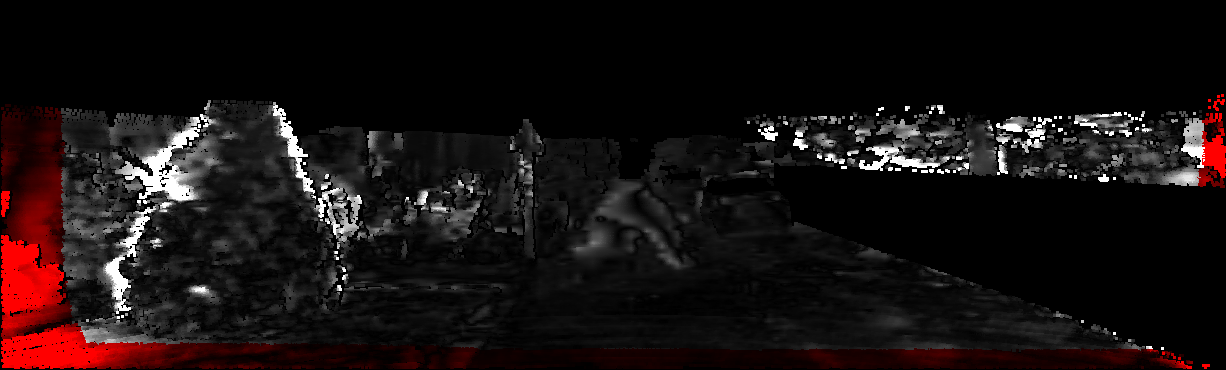
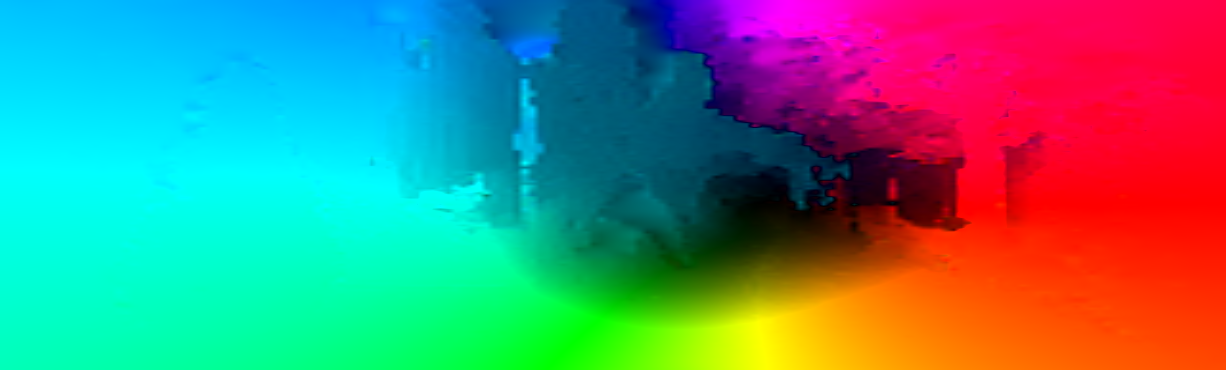
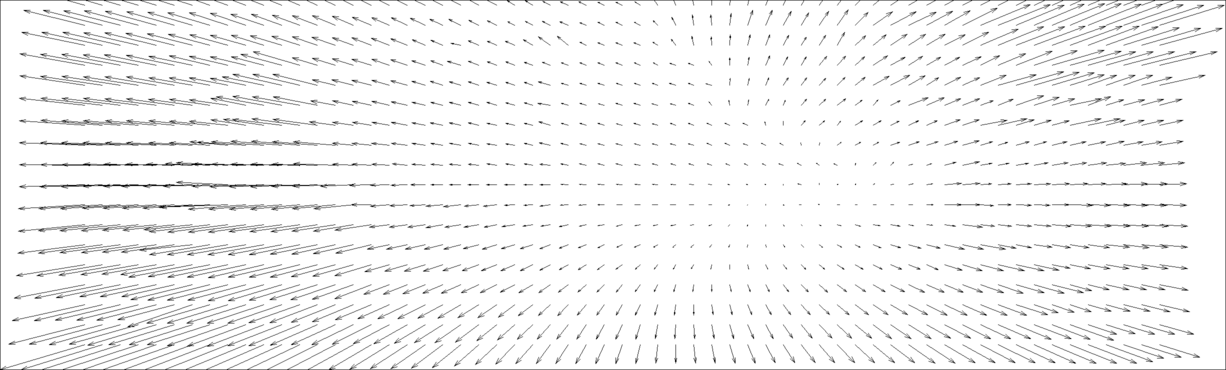
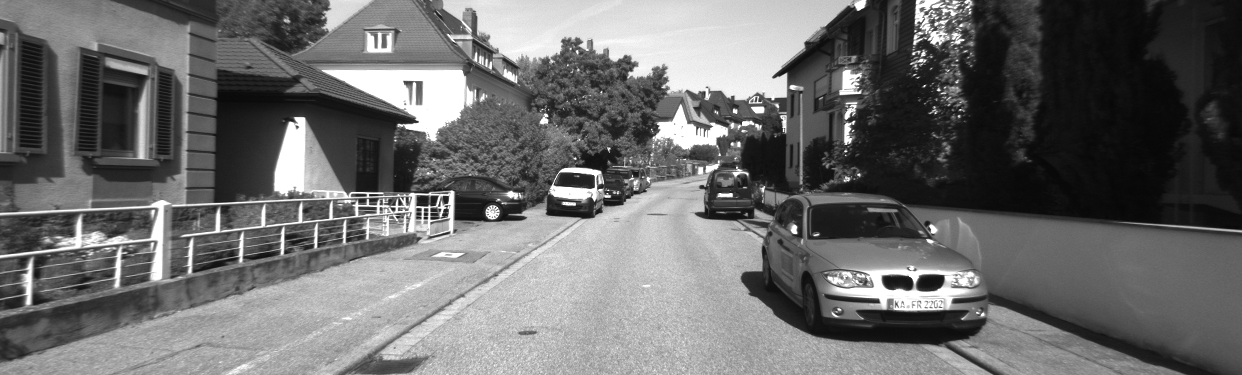
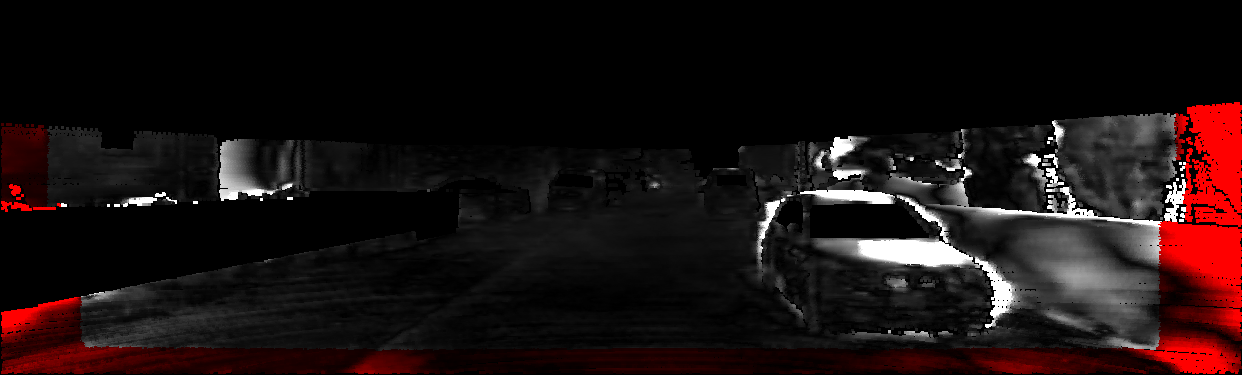
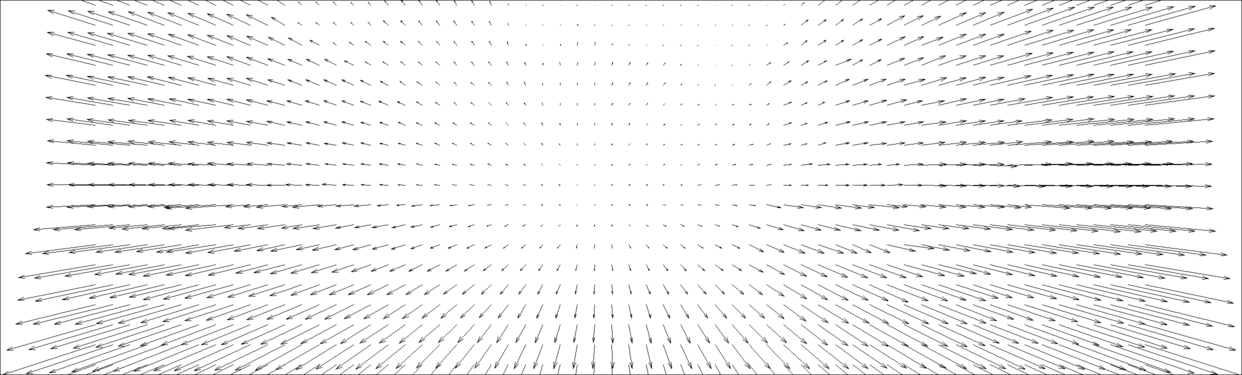
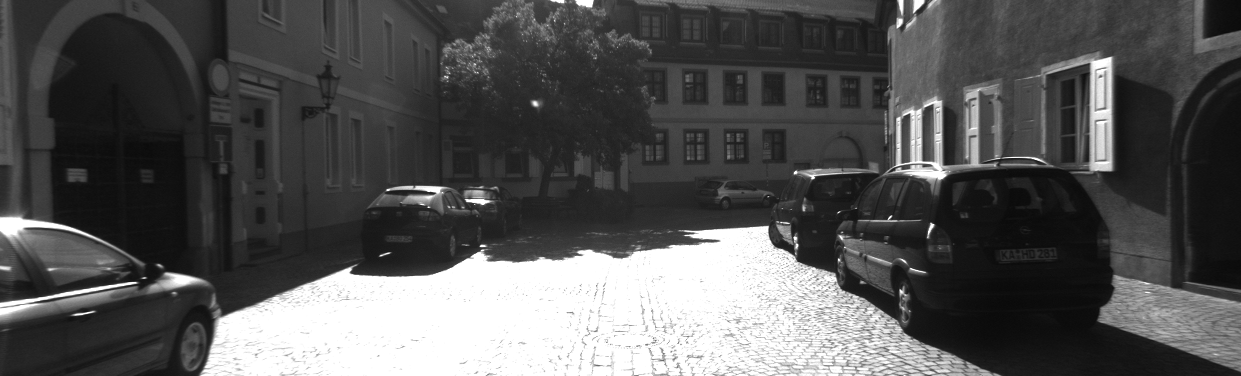
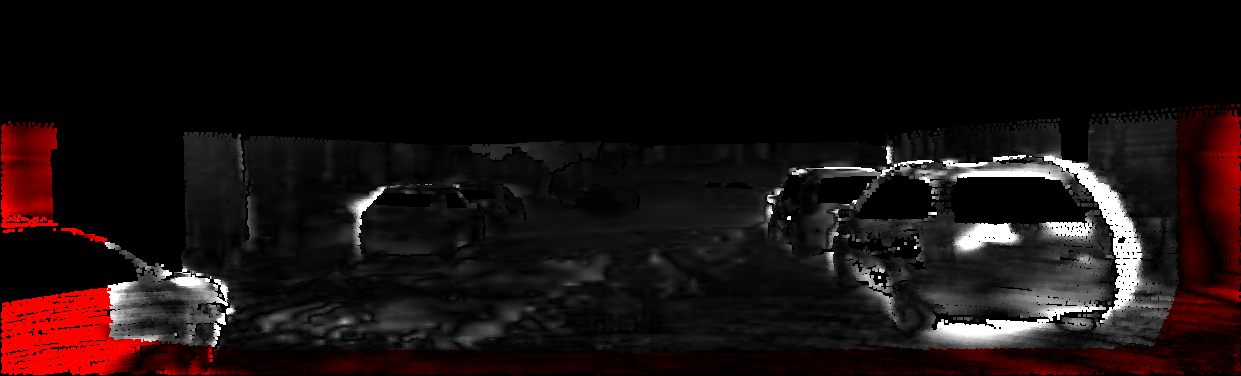
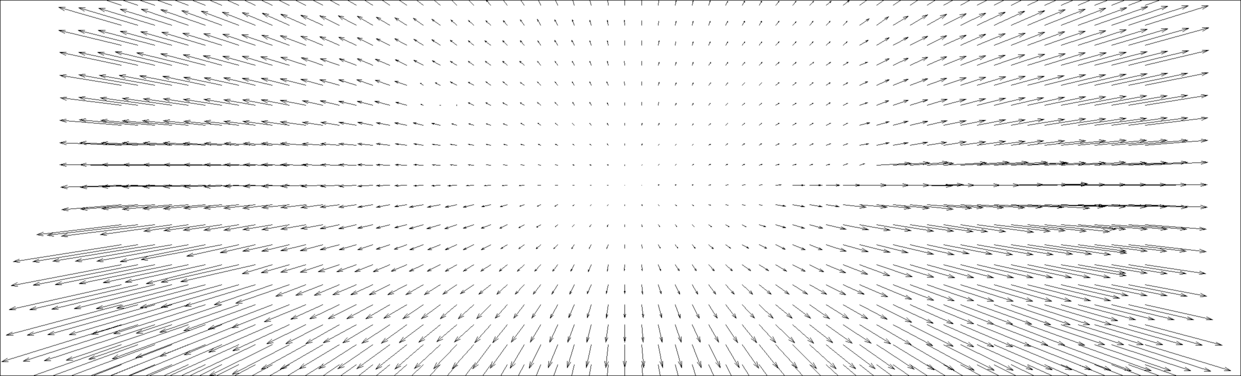
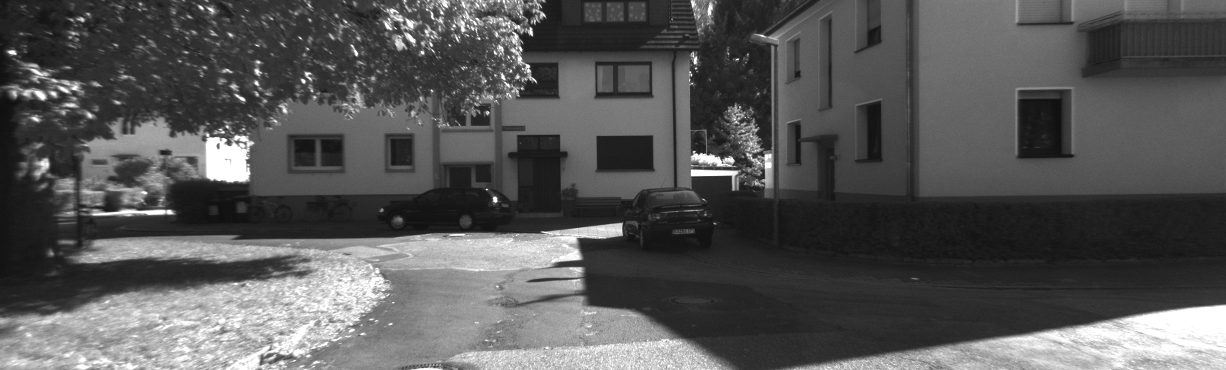
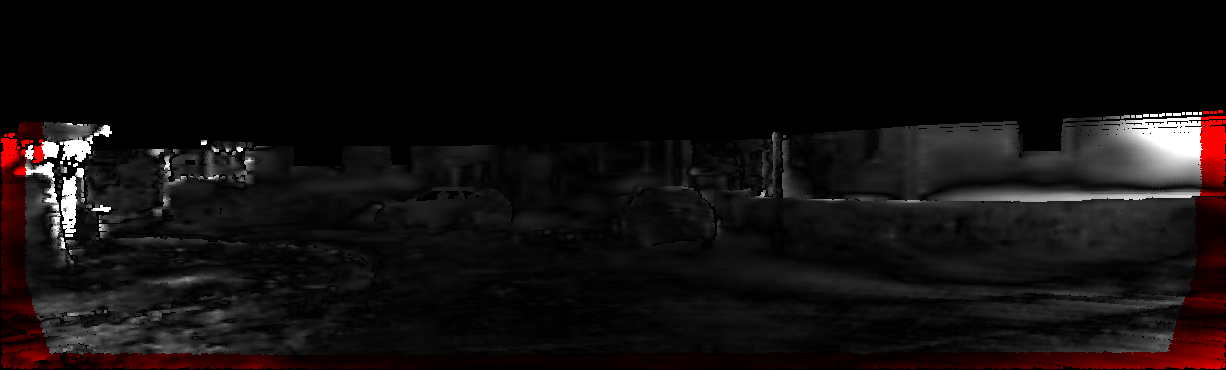
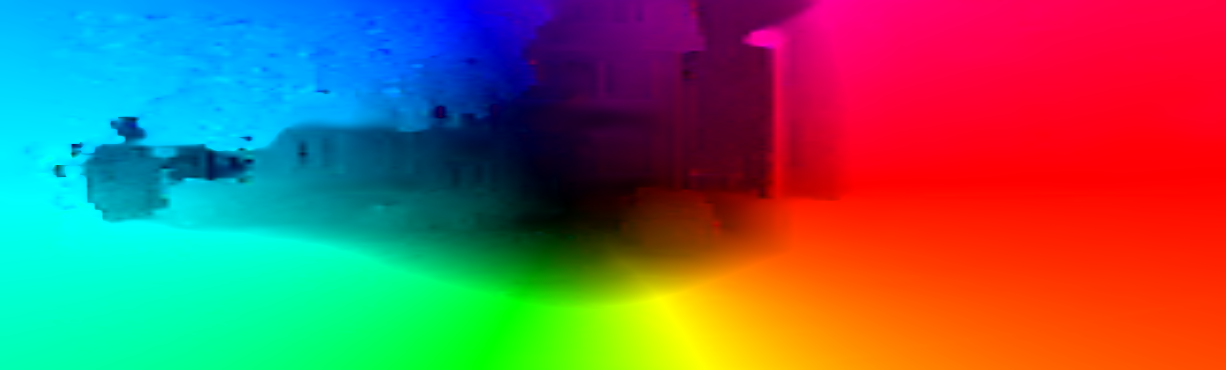
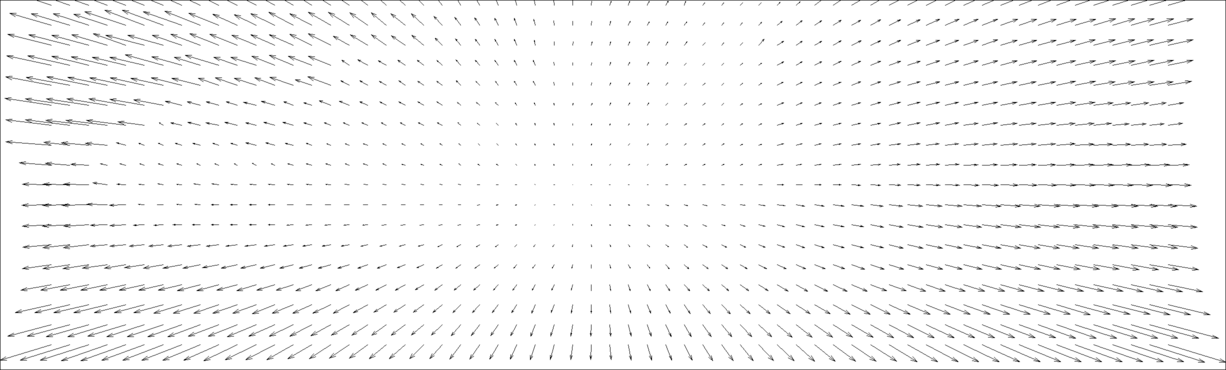
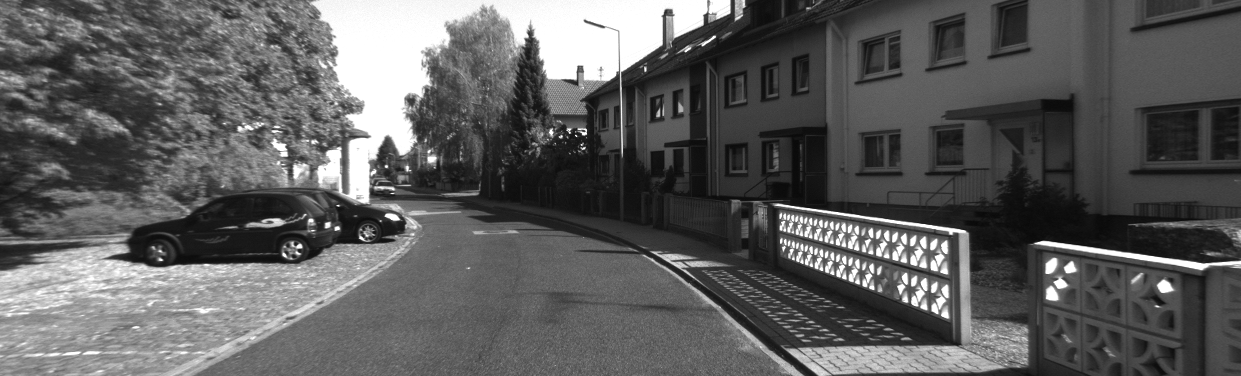
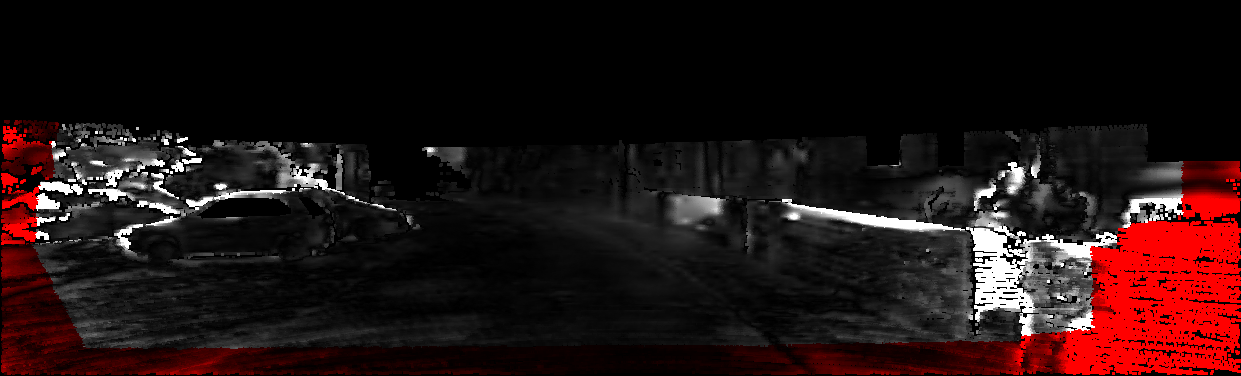
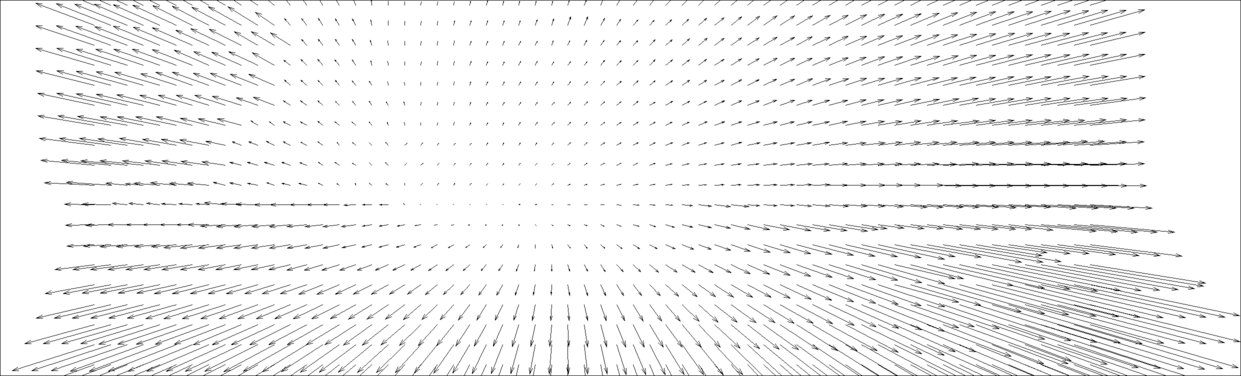
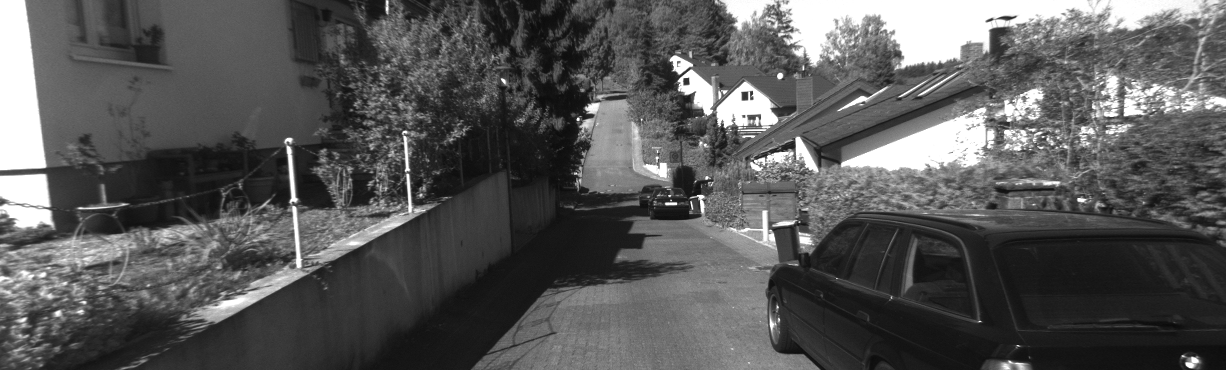
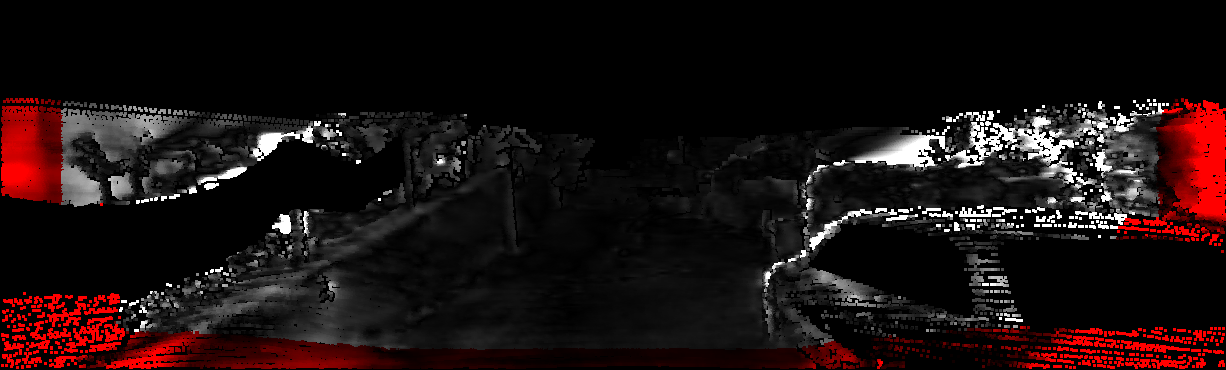
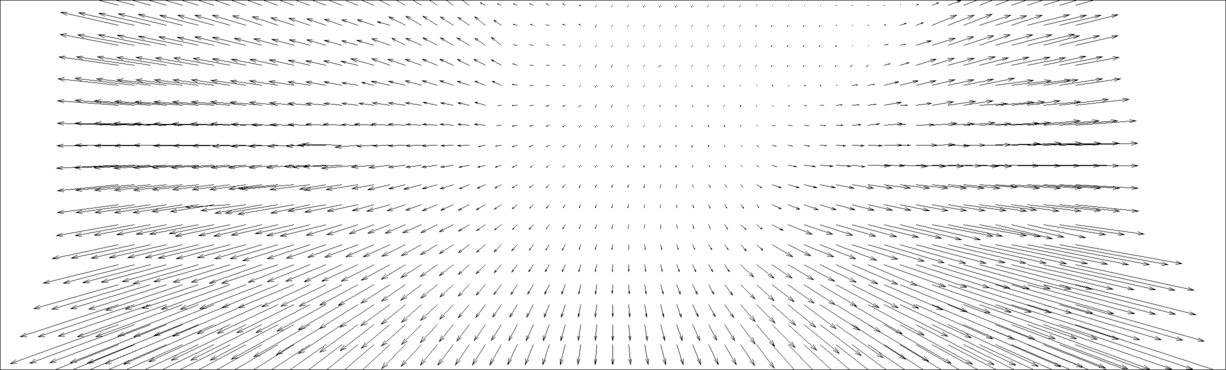
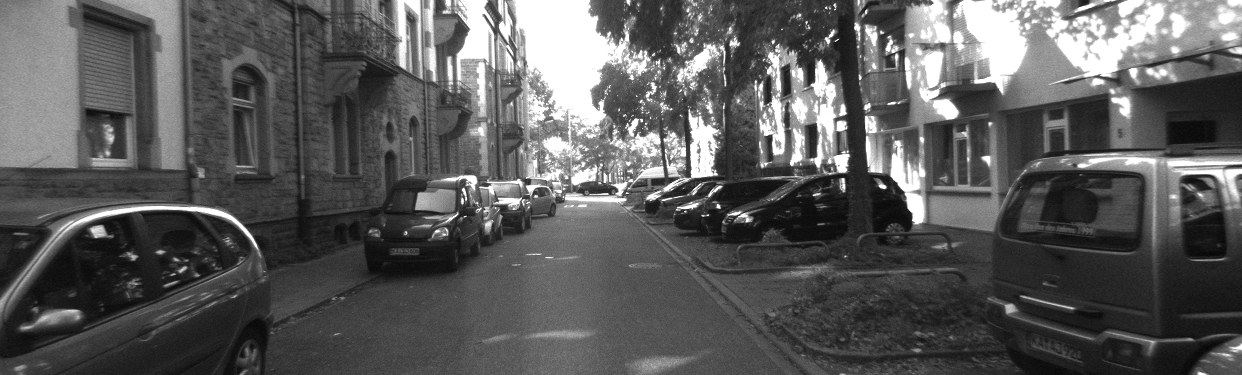
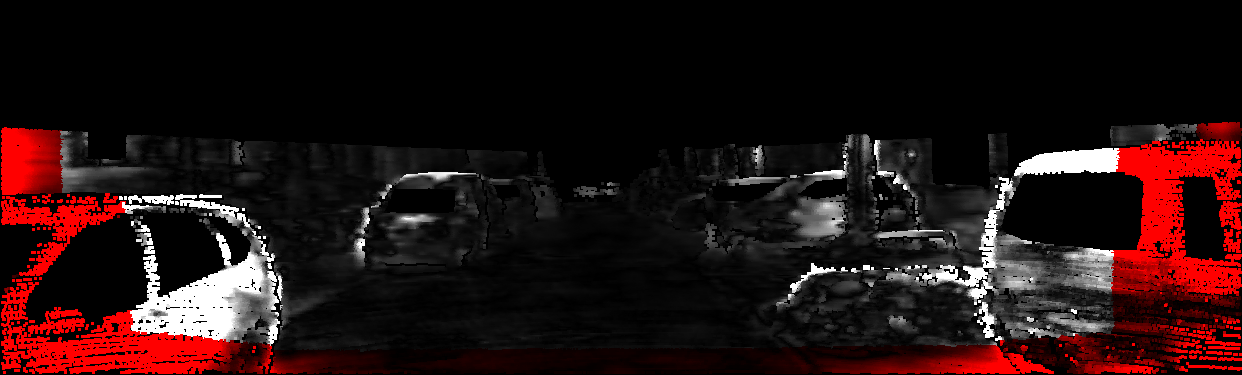
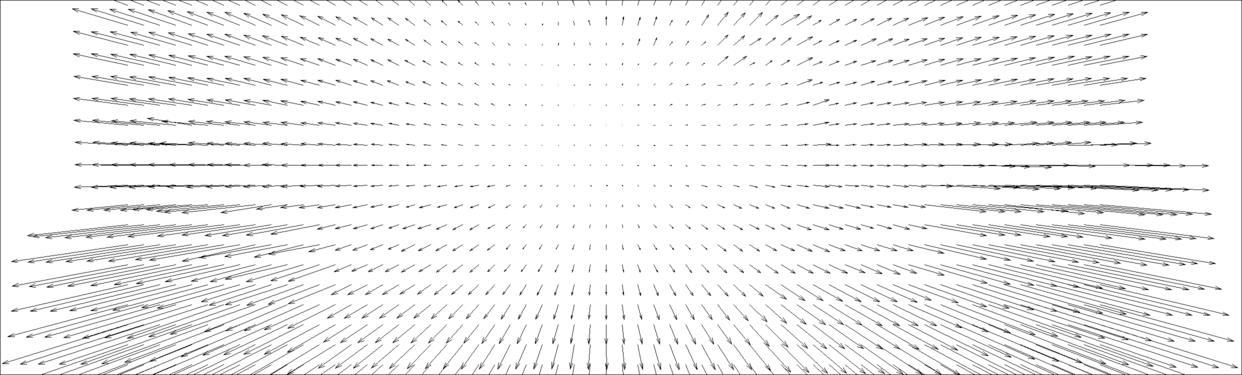
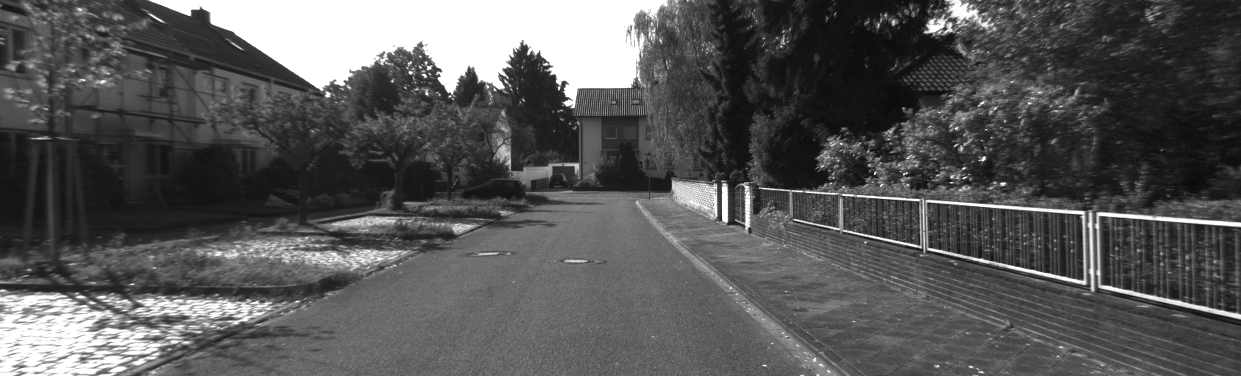
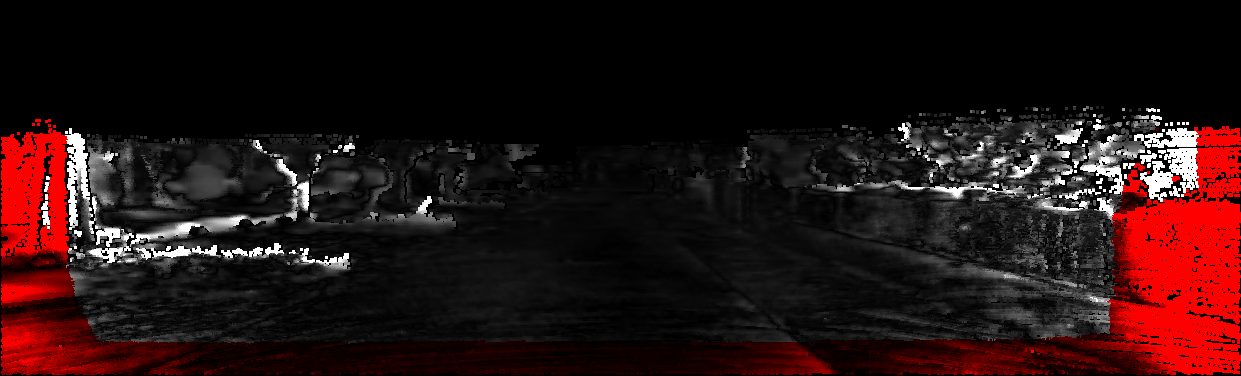
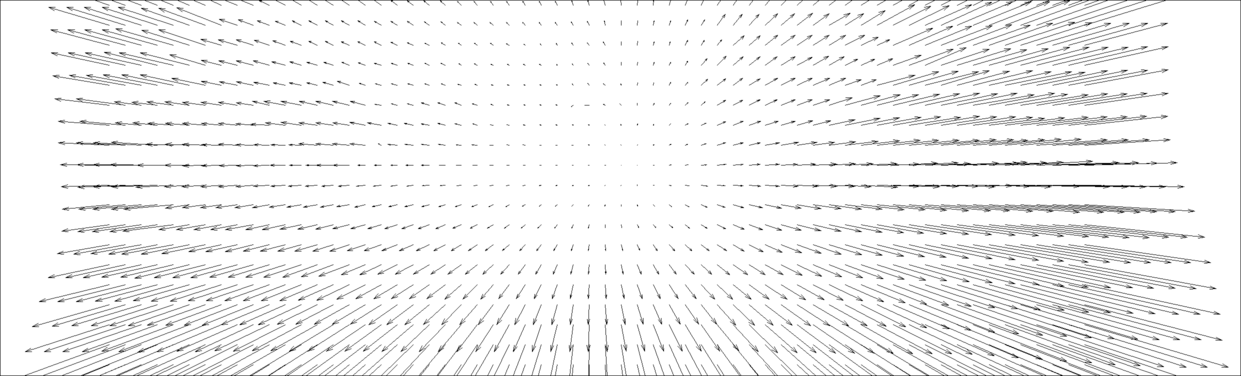
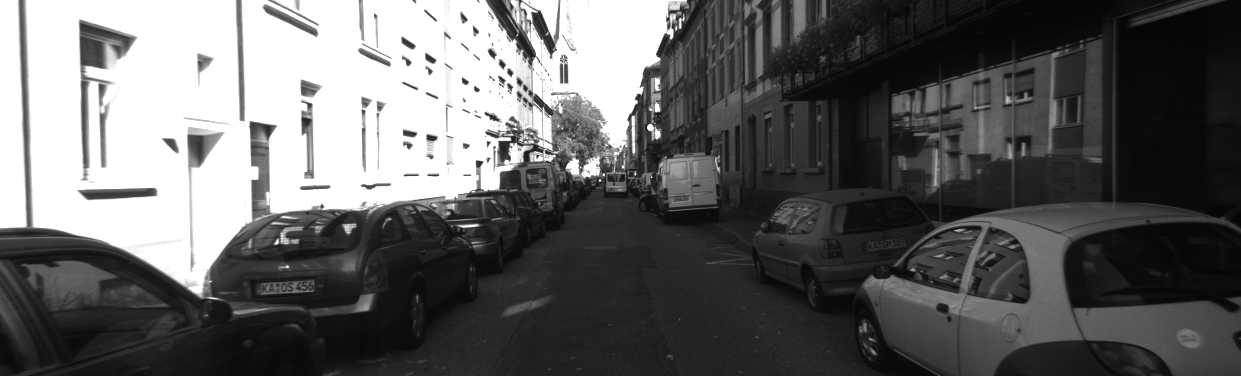
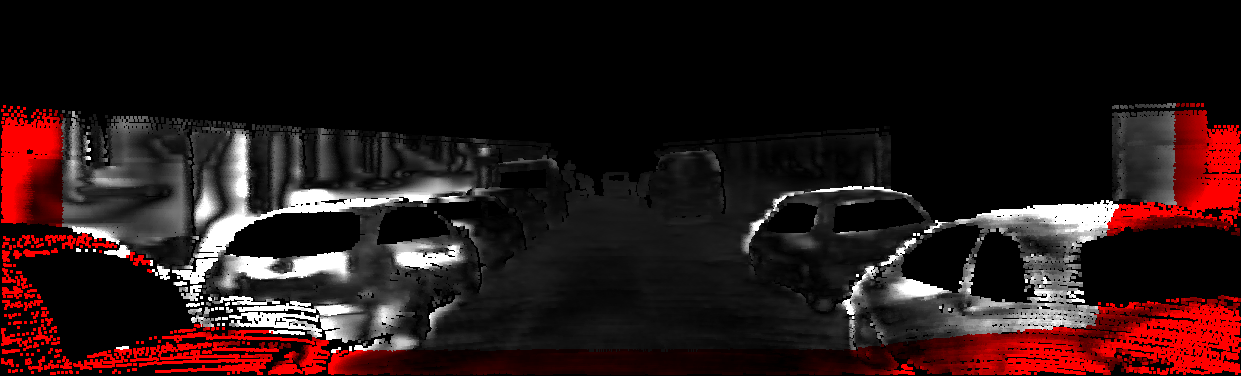
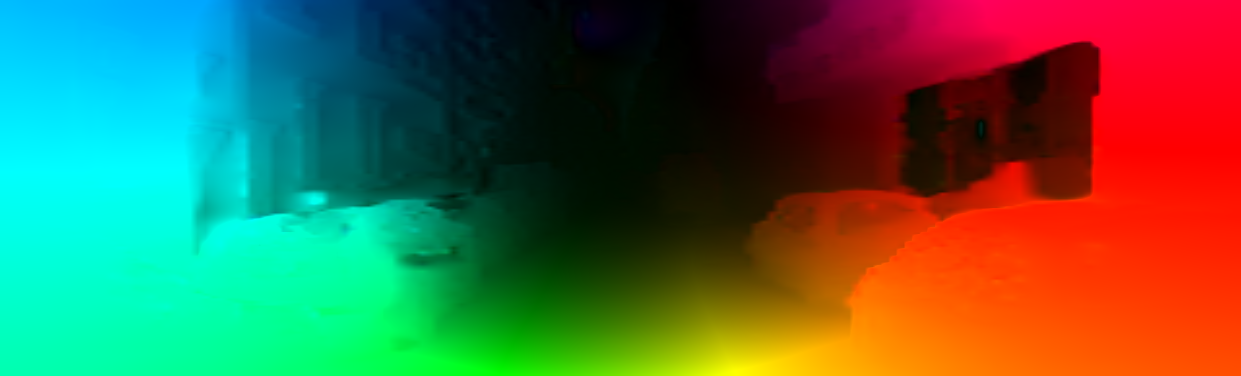
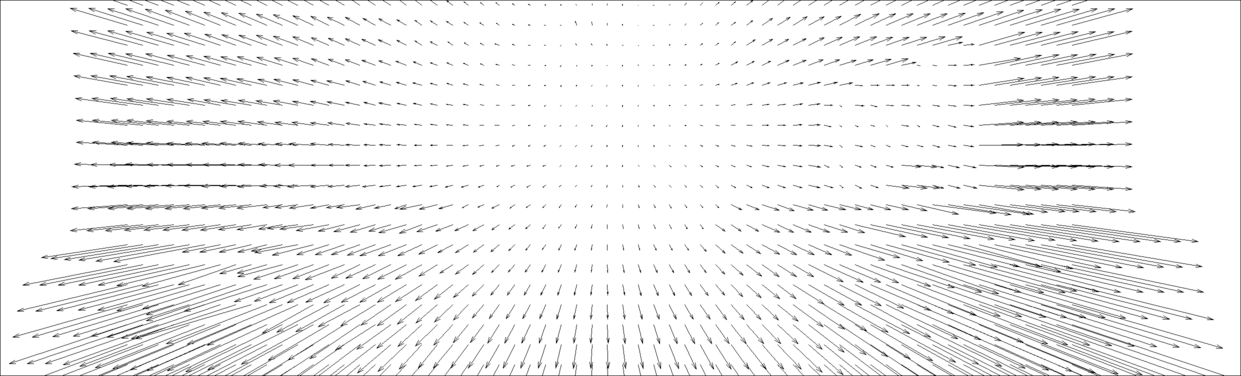
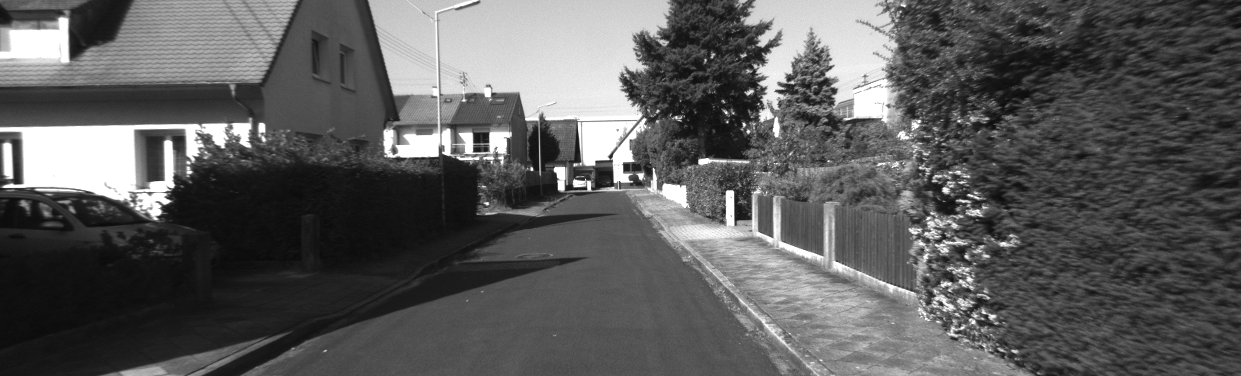
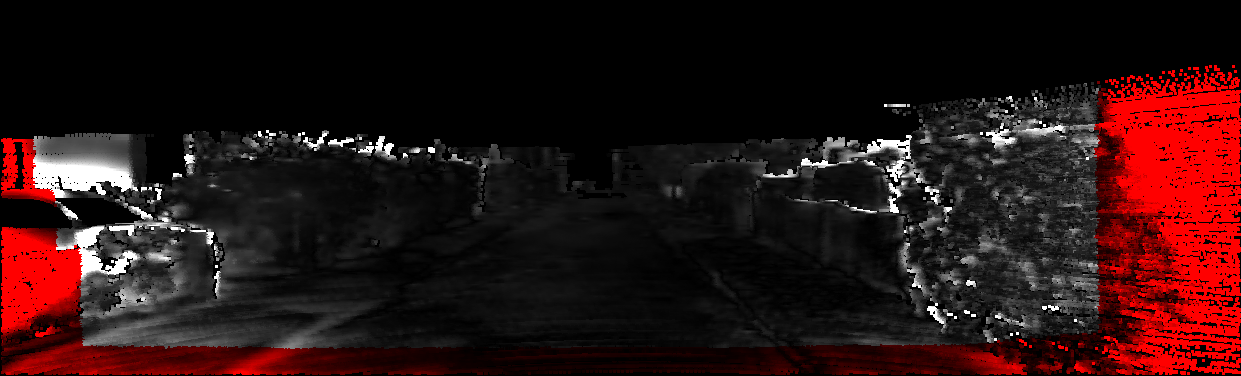
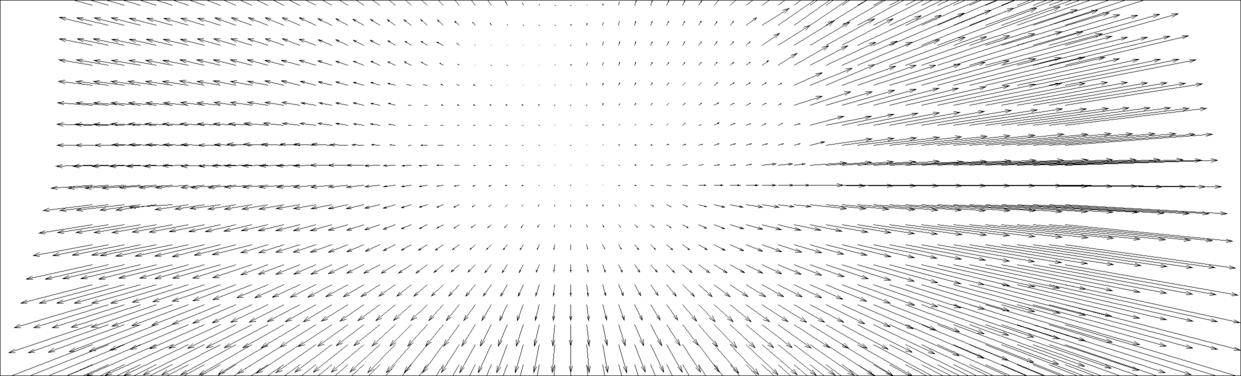
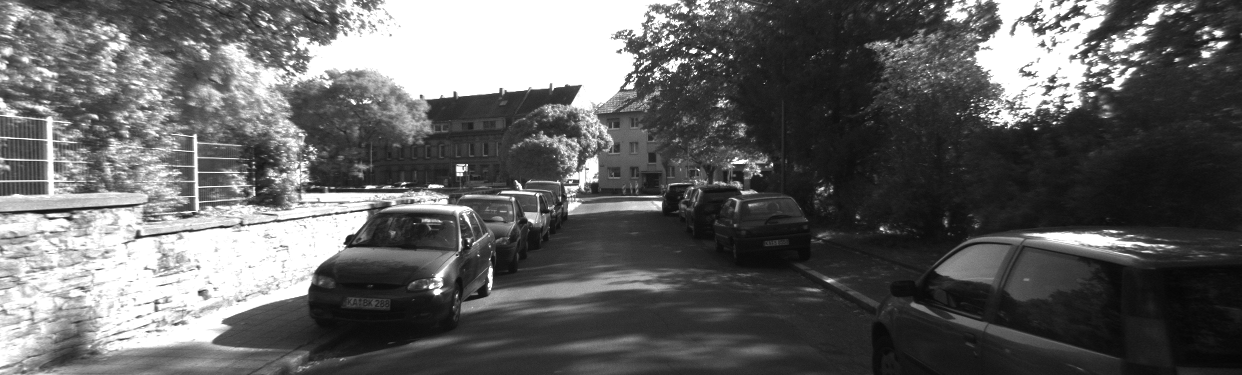
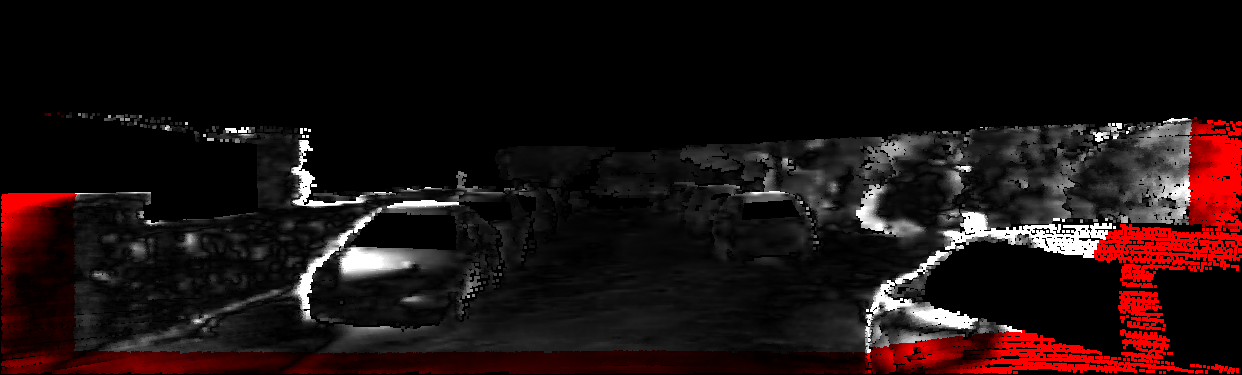
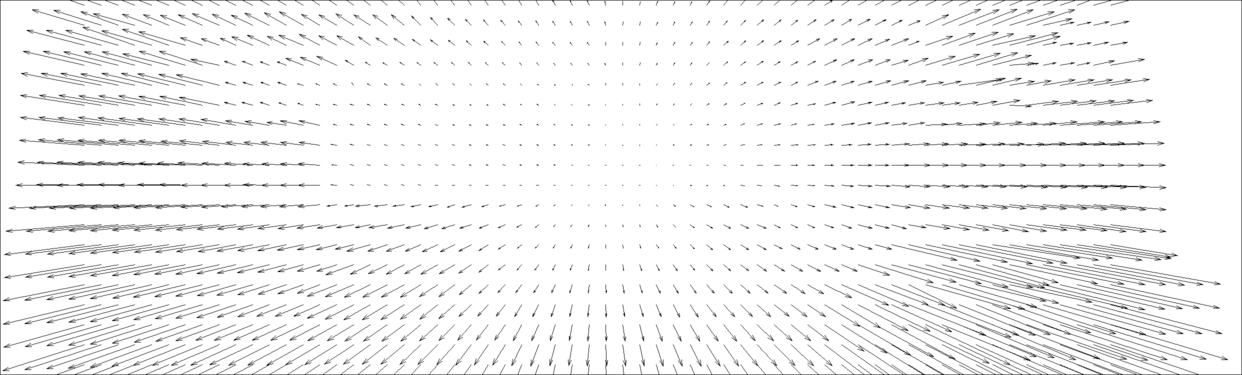
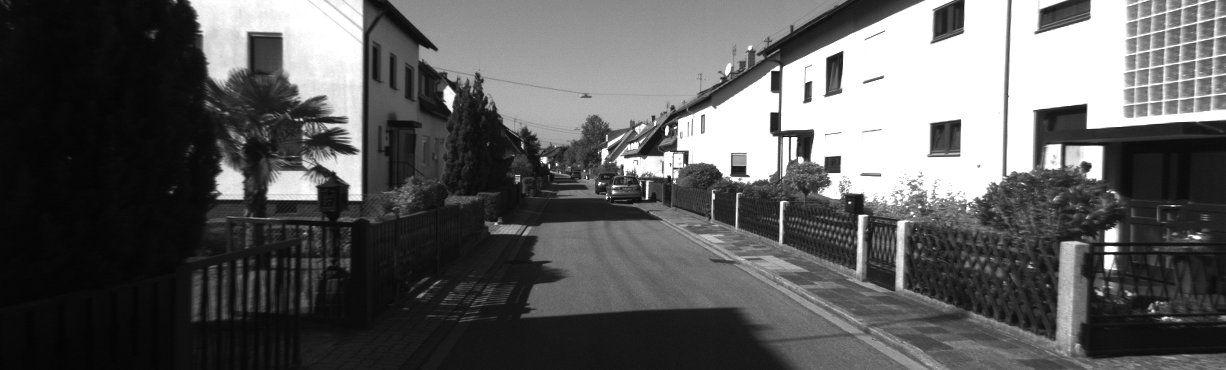
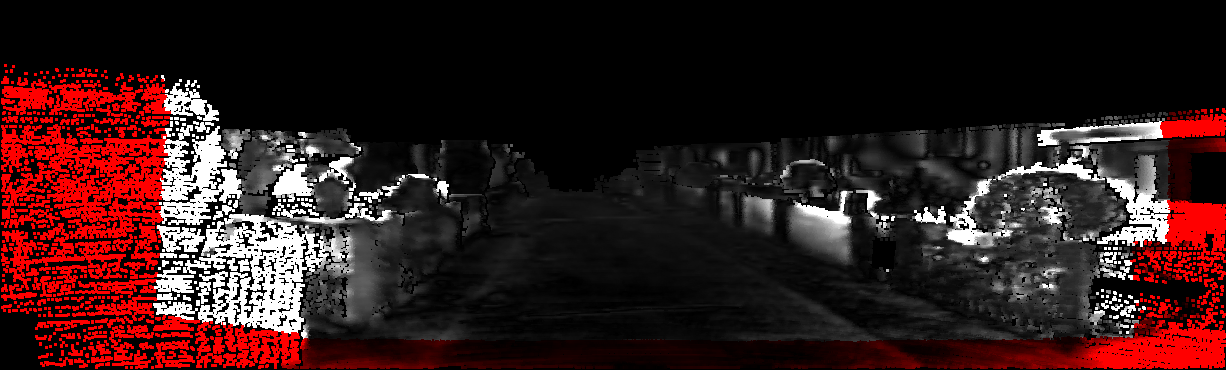
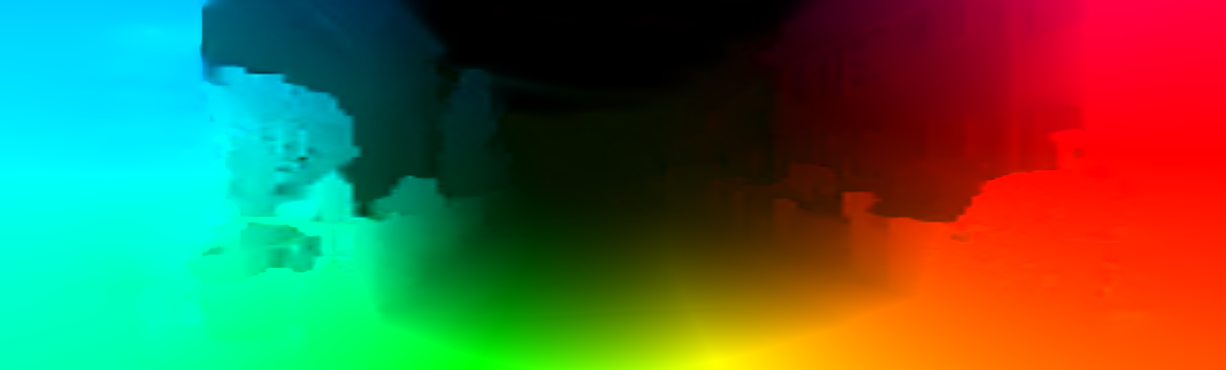
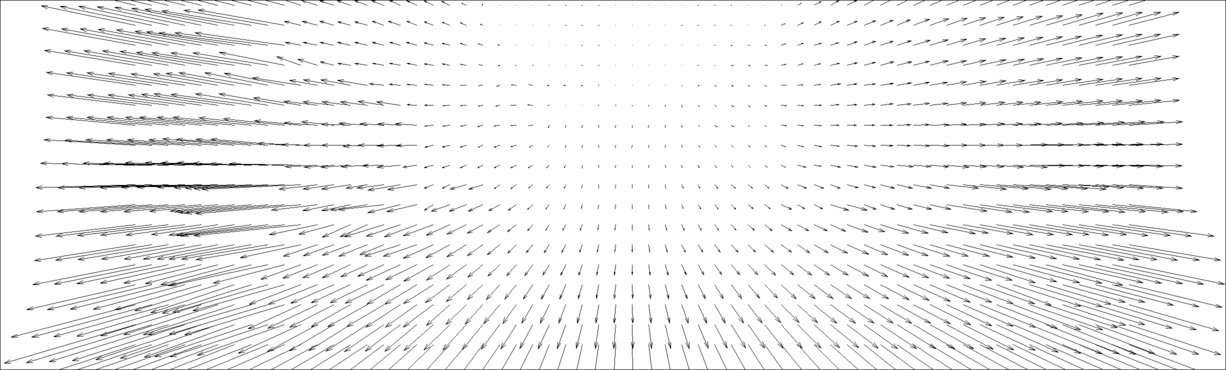
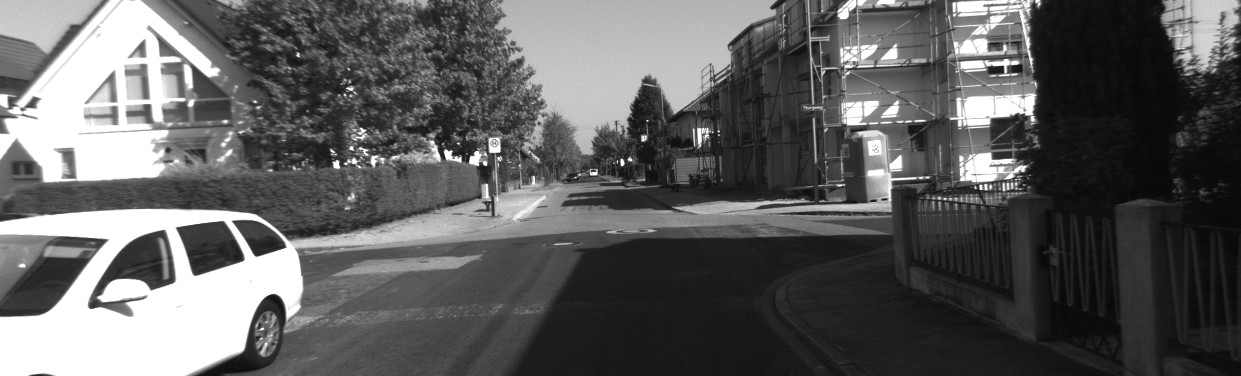
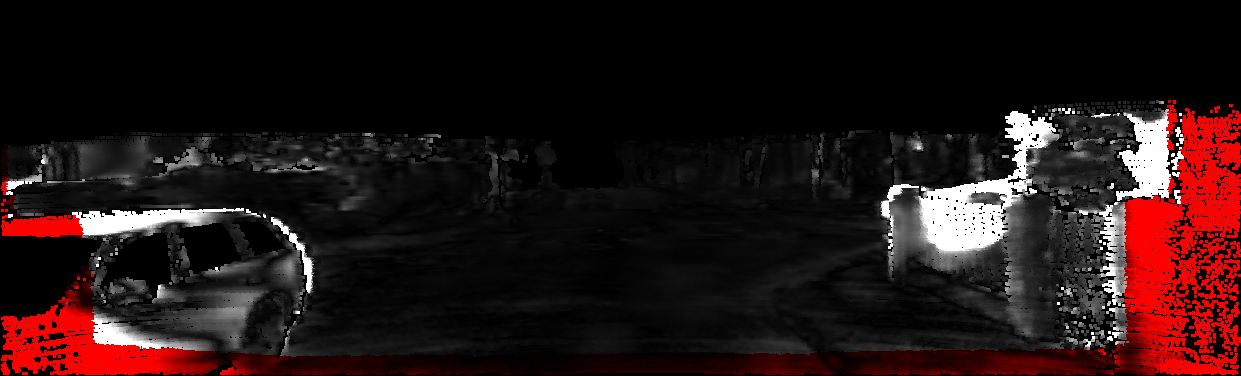
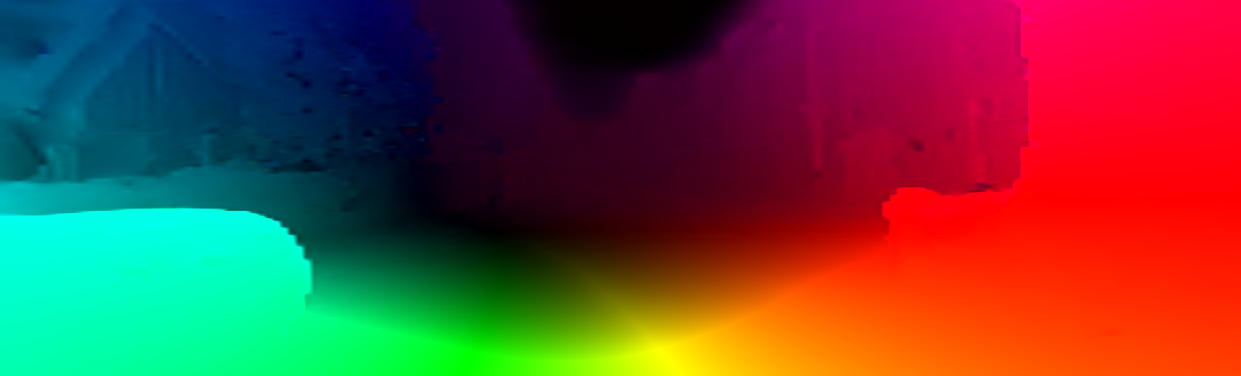
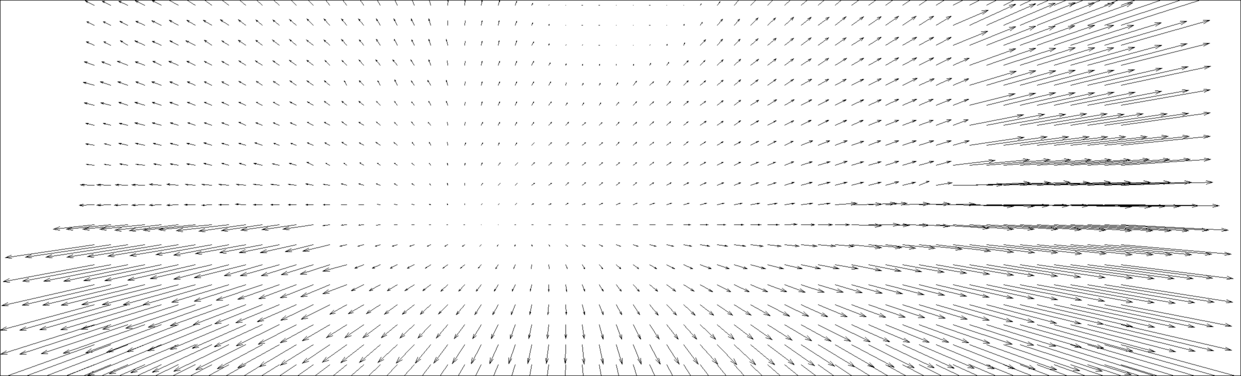
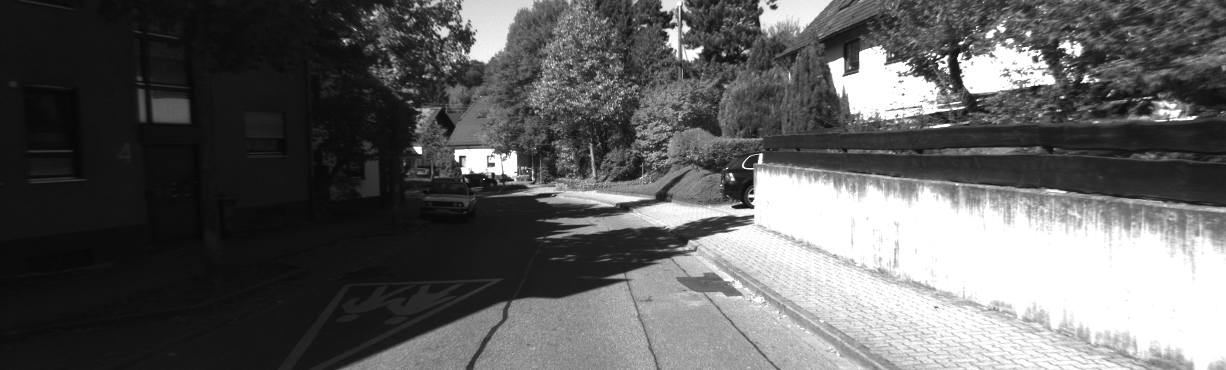
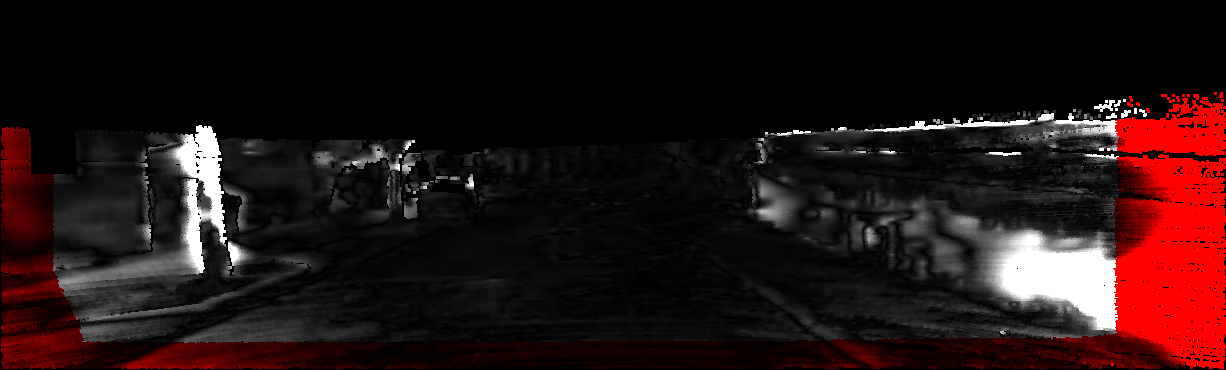
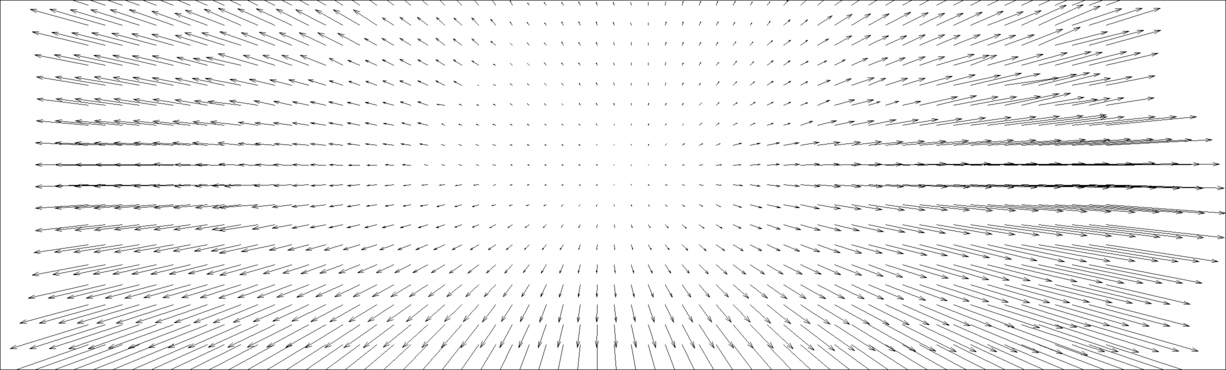
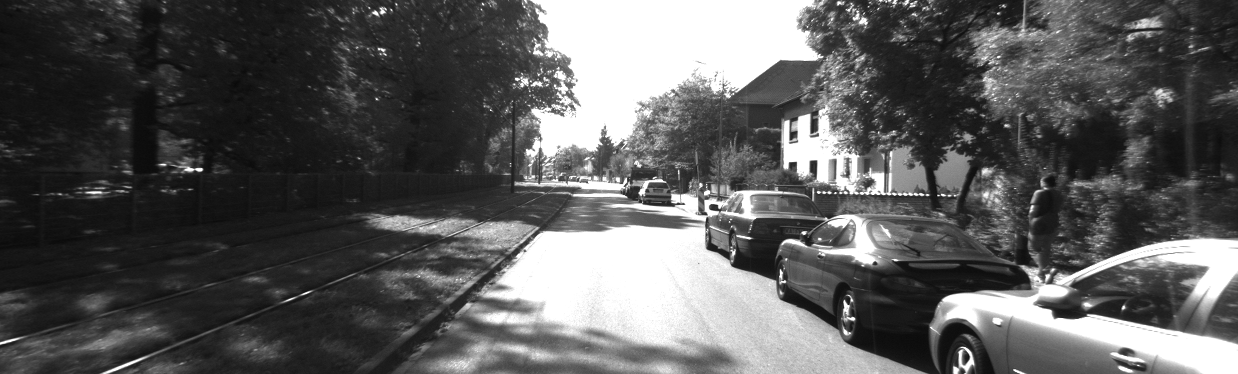
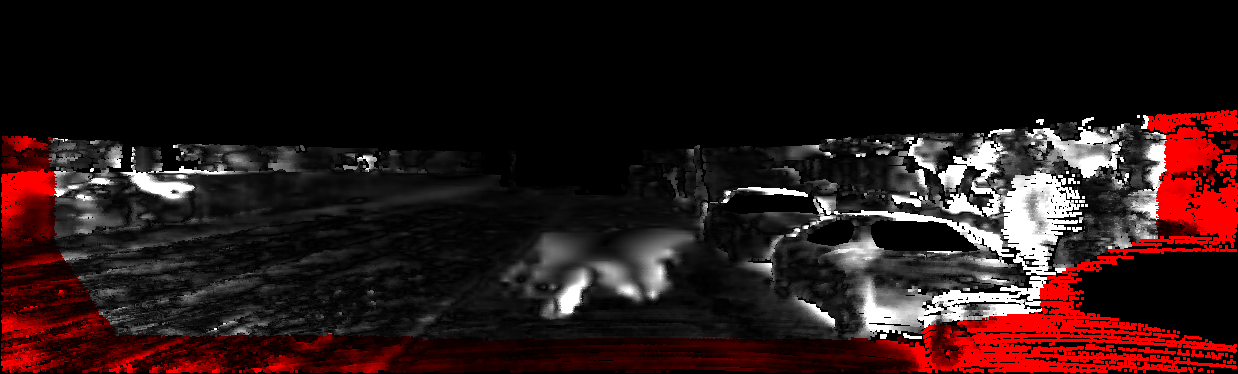
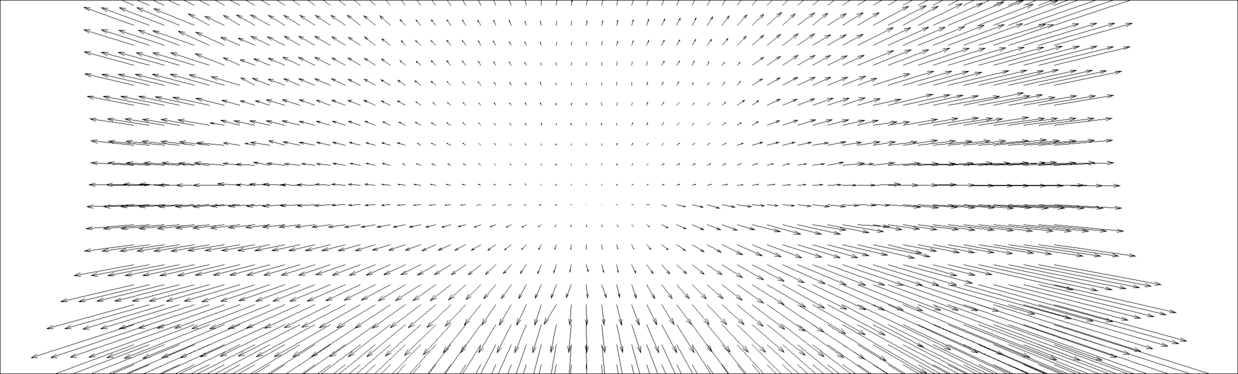
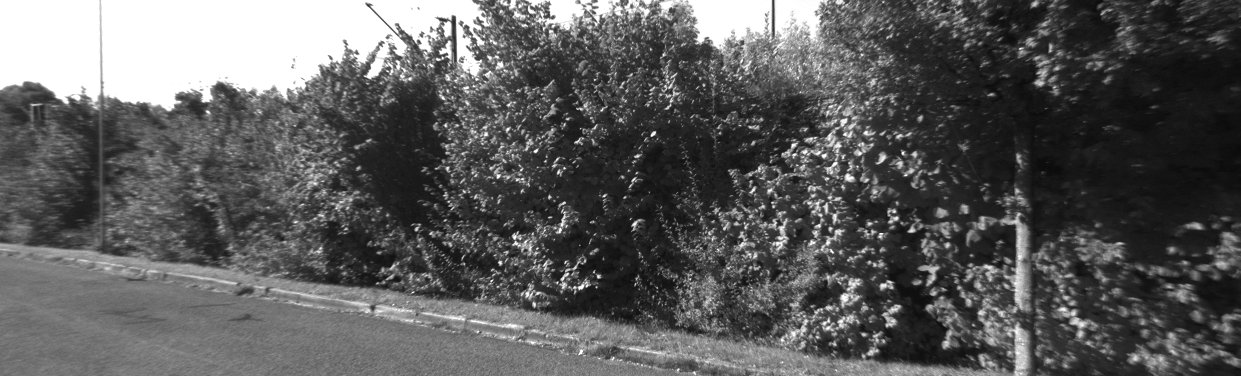
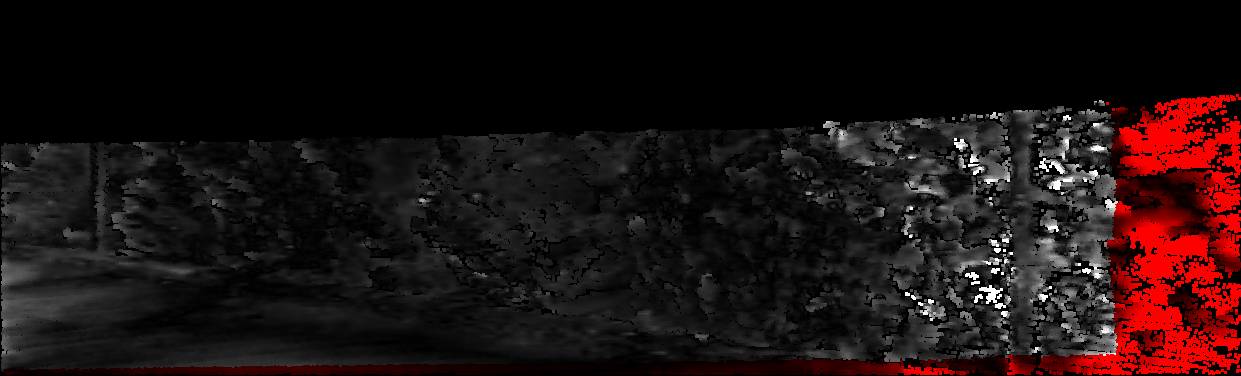
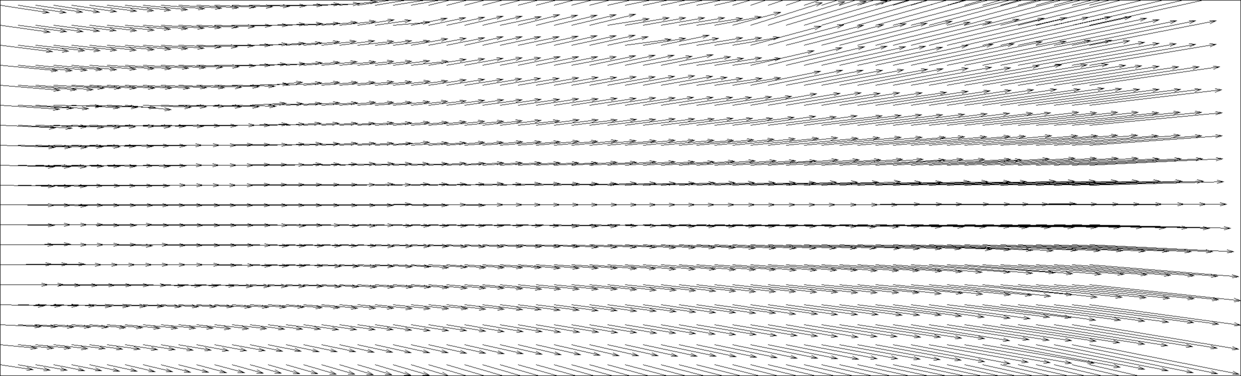
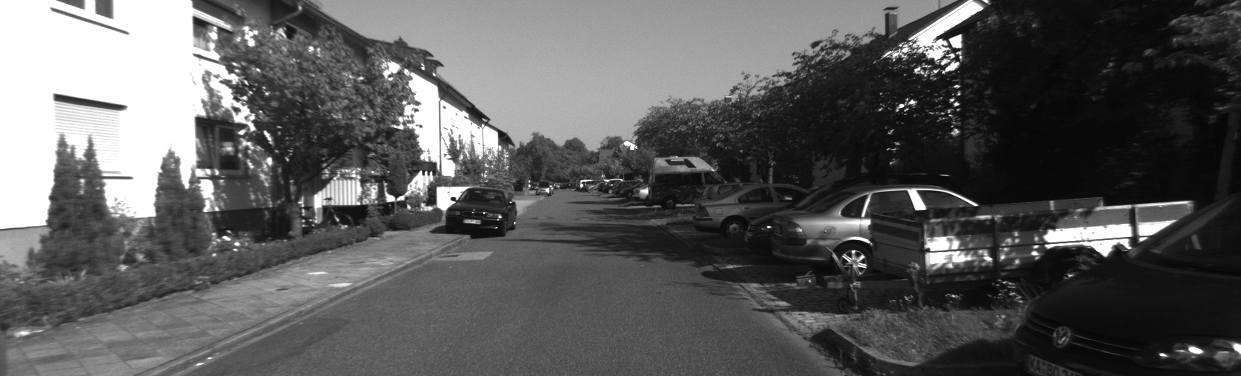
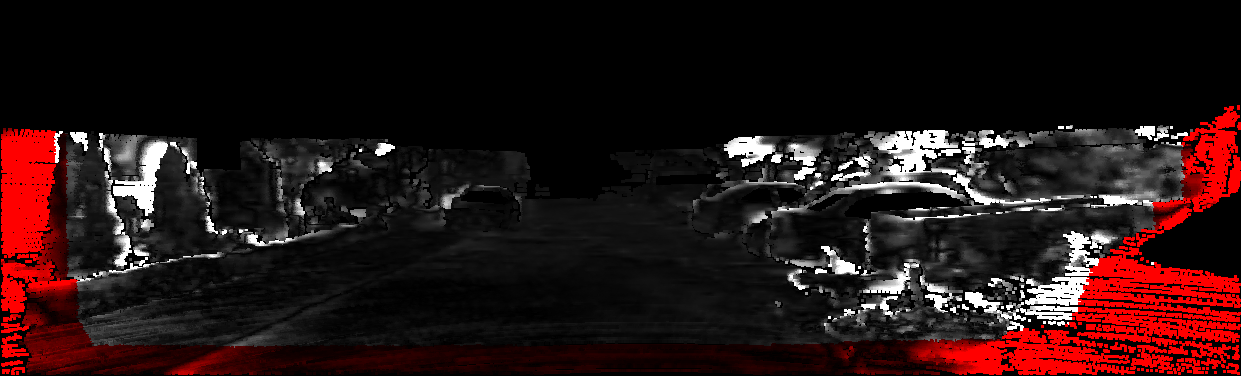
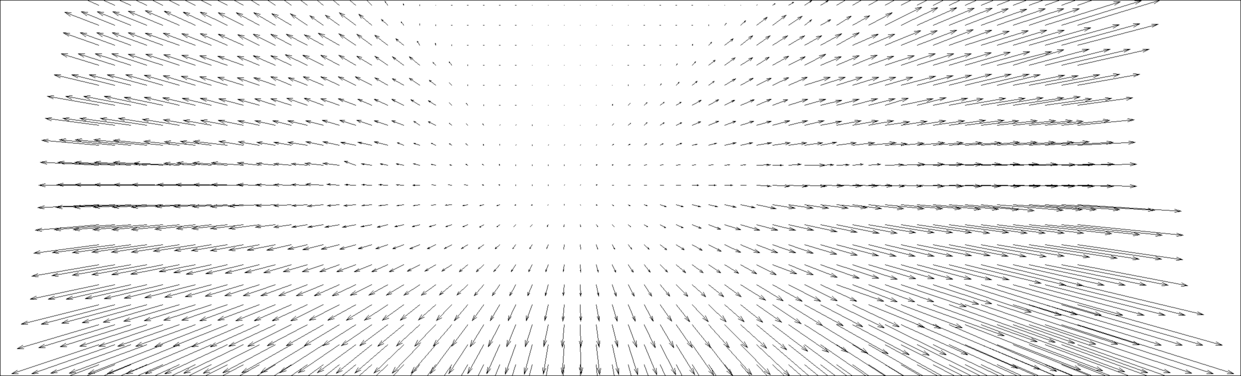
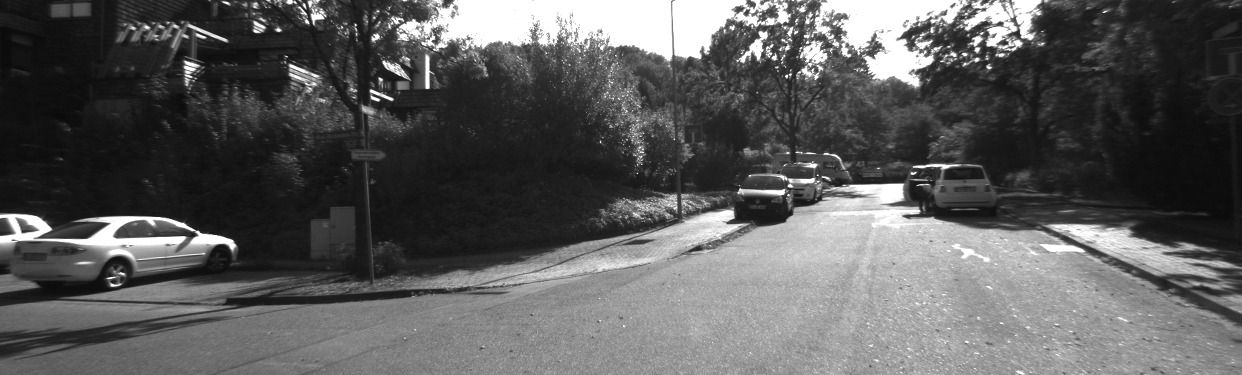
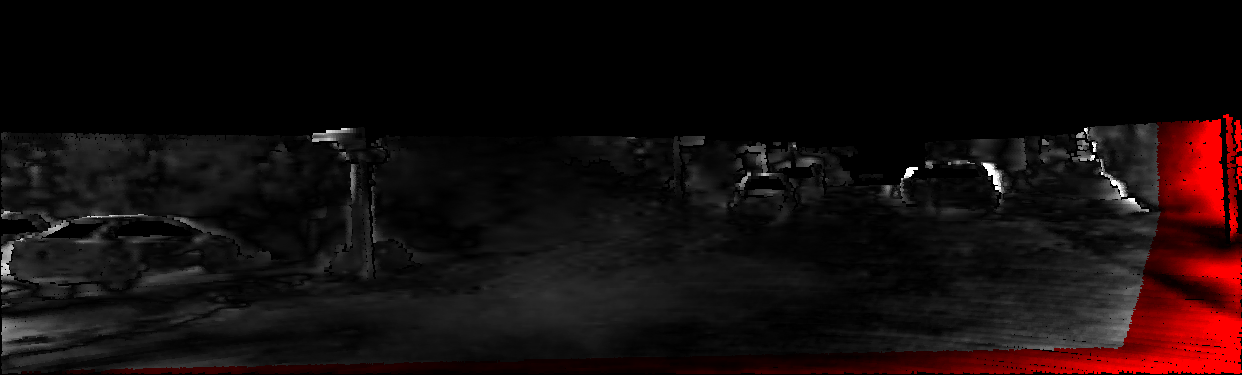
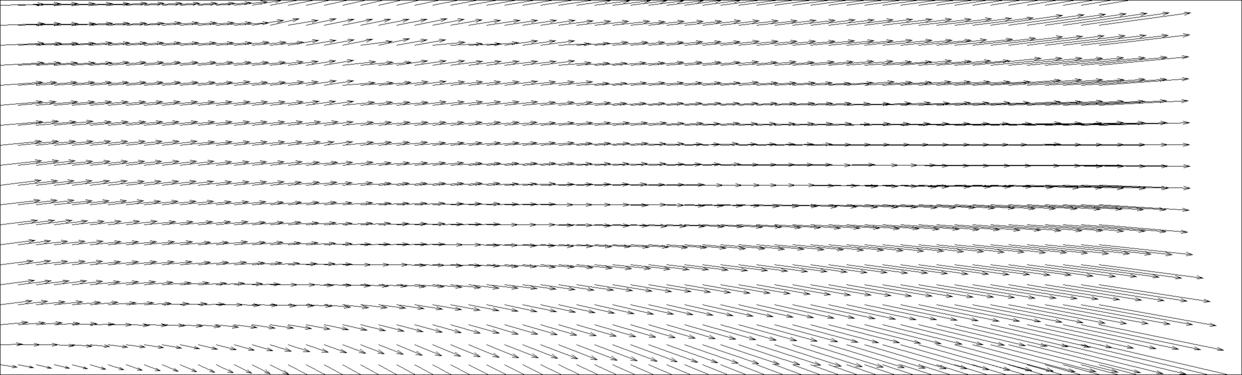
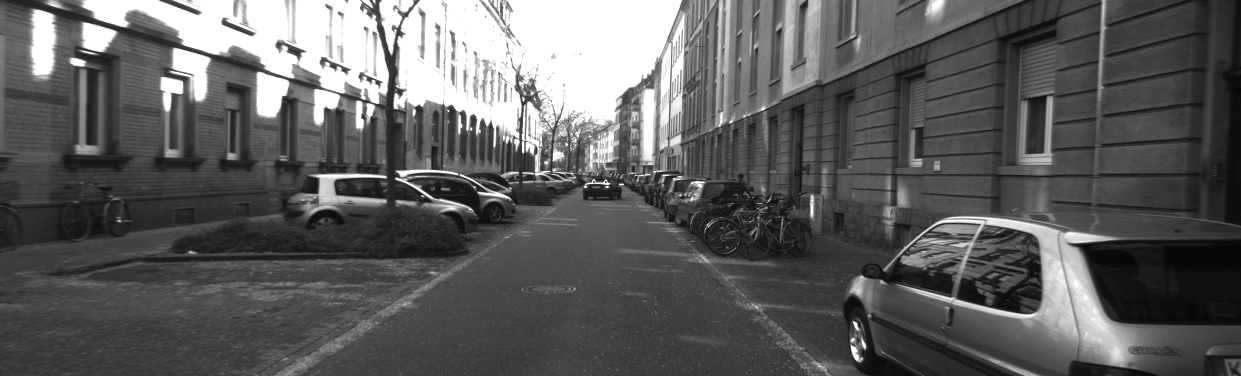
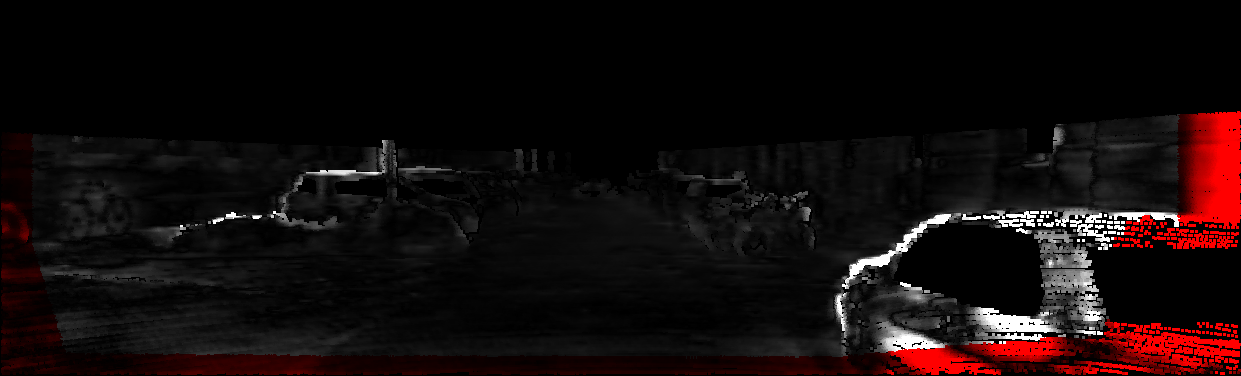
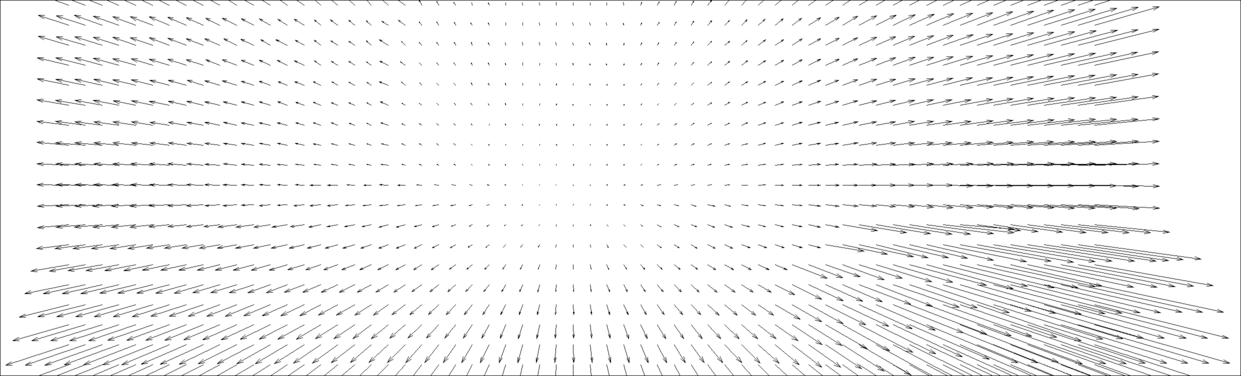
This page provides detailed results for the method(s) selected. For each of the first 20 test images, the number of erroneous pixels at all thresholds is depicted in the table. Underneath, the left input image, the disparity / end-point error map and the estimated (and interpolated) disparity / optical flow map are shown. The error map scales linearly between 0 (black) and >=5 (white) pixels error. Red denotes all occluded pixels, falling outside the image boundaries. The false color map is scaled to the largest ground truth disparity / flow value.

Test Set Average

Error Out-Noc Out-All Avg-Noc Avg-All
2 pixels 6.57 % 10.96 % 0.9 px 1.9 px
3 pixels 4.26 % 7.91 % 0.9 px 1.9 px
4 pixels 3.24 % 6.40 % 0.9 px 1.9 px
5 pixels 2.66 % 5.46 % 0.9 px 1.9 px
This table as LaTeX

Reflective Regions

This table as LaTeX

Test Image 0

Error Out-Noc Out-All Avg-Noc Avg-All
2 pixels 8.91 % 12.32 % 1.0 px 1.6 px
3 pixels 6.47 % 9.65 % 1.0 px 1.6 px
4 pixels 5.11 % 8.18 % 1.0 px 1.6 px
5 pixels 4.25 % 7.20 % 1.0 px 1.6 px
This table as LaTeX


This figure as: png eps pdf txt gnuplot


Test Image 1

Error Out-Noc Out-All Avg-Noc Avg-All
2 pixels 4.89 % 7.76 % 0.6 px 0.8 px
3 pixels 3.02 % 5.23 % 0.6 px 0.8 px
4 pixels 2.04 % 3.94 % 0.6 px 0.8 px
5 pixels 1.55 % 2.96 % 0.6 px 0.8 px
This table as LaTeX


This figure as: png eps pdf txt gnuplot


Test Image 2

Error Out-Noc Out-All Avg-Noc Avg-All
2 pixels 6.62 % 10.23 % 0.8 px 1.2 px
3 pixels 3.88 % 7.05 % 0.8 px 1.2 px
4 pixels 2.90 % 5.81 % 0.8 px 1.2 px
5 pixels 2.46 % 4.96 % 0.8 px 1.2 px
This table as LaTeX


This figure as: png eps pdf txt gnuplot


Test Image 3

Error Out-Noc Out-All Avg-Noc Avg-All
2 pixels 5.47 % 8.58 % 0.7 px 1.1 px
3 pixels 3.55 % 5.57 % 0.7 px 1.1 px
4 pixels 2.59 % 4.28 % 0.7 px 1.1 px
5 pixels 1.99 % 3.58 % 0.7 px 1.1 px
This table as LaTeX


This figure as: png eps pdf txt gnuplot


Test Image 4

Error Out-Noc Out-All Avg-Noc Avg-All
2 pixels 2.59 % 3.34 % 0.5 px 0.6 px
3 pixels 1.72 % 2.14 % 0.5 px 0.6 px
4 pixels 1.20 % 1.50 % 0.5 px 0.6 px
5 pixels 0.93 % 1.18 % 0.5 px 0.6 px
This table as LaTeX


This figure as: png eps pdf txt gnuplot


Test Image 5

Error Out-Noc Out-All Avg-Noc Avg-All
2 pixels 5.86 % 10.25 % 0.9 px 2.7 px
3 pixels 3.92 % 7.88 % 0.9 px 2.7 px
4 pixels 2.99 % 6.79 % 0.9 px 2.7 px
5 pixels 2.49 % 6.20 % 0.9 px 2.7 px
This table as LaTeX


This figure as: png eps pdf txt gnuplot


Test Image 6

Error Out-Noc Out-All Avg-Noc Avg-All
2 pixels 6.89 % 12.11 % 0.8 px 1.2 px
3 pixels 4.05 % 7.99 % 0.8 px 1.2 px
4 pixels 2.89 % 5.77 % 0.8 px 1.2 px
5 pixels 2.33 % 4.56 % 0.8 px 1.2 px
This table as LaTeX


This figure as: png eps pdf txt gnuplot


Test Image 7

Error Out-Noc Out-All Avg-Noc Avg-All
2 pixels 9.51 % 16.58 % 1.3 px 2.7 px
3 pixels 6.67 % 12.97 % 1.3 px 2.7 px
4 pixels 5.19 % 10.70 % 1.3 px 2.7 px
5 pixels 4.52 % 9.51 % 1.3 px 2.7 px
This table as LaTeX


This figure as: png eps pdf txt gnuplot


Test Image 8

Error Out-Noc Out-All Avg-Noc Avg-All
2 pixels 4.55 % 11.53 % 0.8 px 2.0 px
3 pixels 2.85 % 8.75 % 0.8 px 2.0 px
4 pixels 2.11 % 7.36 % 0.8 px 2.0 px
5 pixels 1.67 % 6.49 % 0.8 px 2.0 px
This table as LaTeX


This figure as: png eps pdf txt gnuplot


Test Image 9

Error Out-Noc Out-All Avg-Noc Avg-All
2 pixels 13.29 % 19.75 % 1.3 px 2.2 px
3 pixels 8.83 % 14.24 % 1.3 px 2.2 px
4 pixels 6.01 % 10.52 % 1.3 px 2.2 px
5 pixels 4.59 % 8.45 % 1.3 px 2.2 px
This table as LaTeX


This figure as: png eps pdf txt gnuplot


Test Image 10

Error Out-Noc Out-All Avg-Noc Avg-All
2 pixels 5.24 % 13.71 % 0.7 px 2.0 px
3 pixels 2.79 % 9.80 % 0.7 px 2.0 px
4 pixels 1.96 % 7.97 % 0.7 px 2.0 px
5 pixels 1.53 % 6.96 % 0.7 px 2.0 px
This table as LaTeX


This figure as: png eps pdf txt gnuplot


Test Image 11

Error Out-Noc Out-All Avg-Noc Avg-All
2 pixels 7.44 % 11.26 % 0.9 px 1.9 px
3 pixels 4.50 % 7.64 % 0.9 px 1.9 px
4 pixels 3.20 % 5.81 % 0.9 px 1.9 px
5 pixels 2.40 % 4.56 % 0.9 px 1.9 px
This table as LaTeX


This figure as: png eps pdf txt gnuplot


Test Image 12

Error Out-Noc Out-All Avg-Noc Avg-All
2 pixels 10.45 % 15.98 % 2.4 px 6.6 px
3 pixels 7.98 % 13.44 % 2.4 px 6.6 px
4 pixels 6.78 % 12.25 % 2.4 px 6.6 px
5 pixels 6.10 % 11.57 % 2.4 px 6.6 px
This table as LaTeX


This figure as: png eps pdf txt gnuplot


Test Image 13

Error Out-Noc Out-All Avg-Noc Avg-All
2 pixels 6.81 % 11.93 % 1.1 px 2.0 px
3 pixels 4.86 % 9.87 % 1.1 px 2.0 px
4 pixels 4.18 % 8.88 % 1.1 px 2.0 px
5 pixels 3.74 % 8.04 % 1.1 px 2.0 px
This table as LaTeX


This figure as: png eps pdf txt gnuplot


Test Image 14

Error Out-Noc Out-All Avg-Noc Avg-All
2 pixels 7.29 % 12.23 % 0.9 px 2.2 px
3 pixels 5.12 % 9.29 % 0.9 px 2.2 px
4 pixels 4.31 % 8.35 % 0.9 px 2.2 px
5 pixels 3.69 % 7.62 % 0.9 px 2.2 px
This table as LaTeX


This figure as: png eps pdf txt gnuplot


Test Image 15

Error Out-Noc Out-All Avg-Noc Avg-All
2 pixels 12.65 % 17.09 % 1.2 px 2.8 px
3 pixels 8.29 % 12.19 % 1.2 px 2.8 px
4 pixels 5.88 % 9.48 % 1.2 px 2.8 px
5 pixels 4.37 % 7.44 % 1.2 px 2.8 px
This table as LaTeX


This figure as: png eps pdf txt gnuplot


Test Image 16

Error Out-Noc Out-All Avg-Noc Avg-All
2 pixels 2.22 % 6.79 % 0.5 px 0.9 px
3 pixels 0.67 % 4.77 % 0.5 px 0.9 px
4 pixels 0.35 % 4.00 % 0.5 px 0.9 px
5 pixels 0.23 % 3.38 % 0.5 px 0.9 px
This table as LaTeX


This figure as: png eps pdf txt gnuplot


Test Image 17

Error Out-Noc Out-All Avg-Noc Avg-All
2 pixels 7.09 % 12.25 % 0.9 px 2.6 px
3 pixels 5.07 % 9.85 % 0.9 px 2.6 px
4 pixels 3.98 % 8.60 % 0.9 px 2.6 px
5 pixels 3.18 % 7.73 % 0.9 px 2.6 px
This table as LaTeX


This figure as: png eps pdf txt gnuplot


Test Image 18

Error Out-Noc Out-All Avg-Noc Avg-All
2 pixels 0.72 % 4.86 % 0.4 px 0.6 px
3 pixels 0.24 % 3.01 % 0.4 px 0.6 px
4 pixels 0.13 % 1.92 % 0.4 px 0.6 px
5 pixels 0.08 % 1.04 % 0.4 px 0.6 px
This table as LaTeX


This figure as: png eps pdf txt gnuplot


Test Image 19

Error Out-Noc Out-All Avg-Noc Avg-All
2 pixels 2.33 % 5.22 % 0.4 px 0.7 px
3 pixels 1.52 % 4.11 % 0.4 px 0.7 px
4 pixels 1.12 % 3.21 % 0.4 px 0.7 px
5 pixels 0.86 % 2.45 % 0.4 px 0.7 px
This table as LaTeX


This figure as: png eps pdf txt gnuplot


eXTReMe Tracker