Method

PolarMOT: How Far Can Geometric Relations Take Us in 3D Multi-Object Tracking? [PolarMOT]
https://polarmot.github.io/

Submitted on 12 Dec. 2021 02:16 by
Aleksandr Kim (Technical University of Munich)

Running time:0.02 s
Environment:1 core @ 2.5 Ghz (C/C++)

Method Description:
State-of-the-art generalizable multi-object tracking as edge classification on a continuously evolved temporal multiplex graph, which contains only pairwise geometric relationships between objects (temporal and spatial) as its initial edge features.

We encode 3D detections as nodes in a graph, where spatial and temporal pairwise relations among objects are encoded via localized polar coordinates on graph edges. This representation makes our geometric relations invariant to global transformations and smooth trajectory changes, especially under non-holonomic motion. This allows our graph neural network to learn to effectively encode temporal and spatial interactions and fully leverage contextual and motion cues to obtain final scene interpretation by posing data association as edge classification. We establish a new state-of-the-art on nuScenes and show that PolarMOT generalizes remarkably well across different locations (Boston, Singapore) and datasets (nuScenes and KITTI).
Parameters:
See paper
Latex Bibtex:
@inproceedings{polarmot,
author = {Aleksandr Kim and Guillem Bras{'o} and Aljo\v{s}a O\v{s}ep and Laura Leal-Taix{'e}},
title = {PolarMOT: How Far Can Geometric Relations Take Us in 3D Multi-Object Tracking?},
booktitle = {European Conference on Computer Vision (ECCV)},
year = {2022},
}

Detailed Results

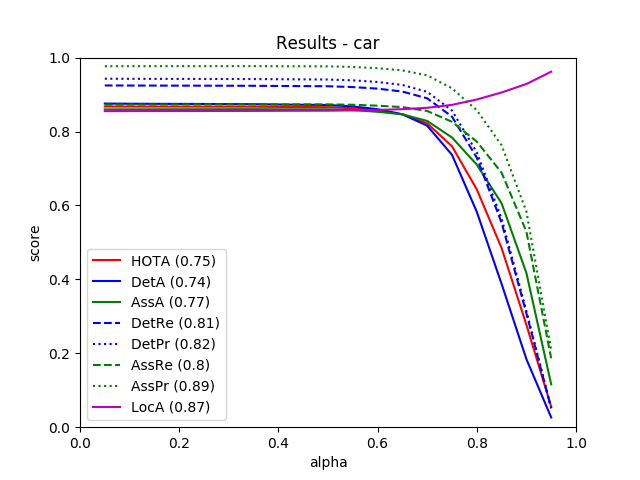
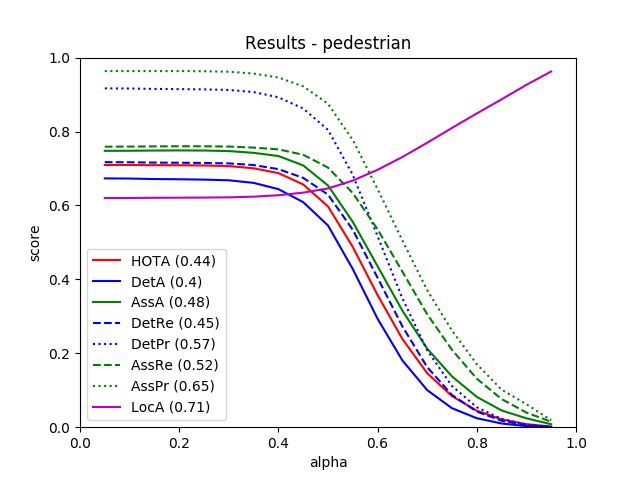
From all 29 test sequences, our benchmark computes the HOTA tracking metrics (HOTA, DetA, AssA, DetRe, DetPr, AssRe, AssPr, LocA) [1] as well as the CLEARMOT, MT/PT/ML, identity switches, and fragmentation [2,3] metrics. The tables below show all of these metrics.


Benchmark HOTA DetA AssA DetRe DetPr AssRe AssPr LocA
CAR 75.16 % 73.94 % 76.95 % 80.81 % 82.40 % 80.00 % 89.27 % 87.12 %
PEDESTRIAN 43.59 % 39.88 % 48.12 % 44.90 % 57.40 % 51.95 % 65.22 % 71.34 %

Benchmark TP FP FN
CAR 31724 2668 2003
PEDESTRIAN 14628 8522 3481

Benchmark MOTA MOTP MODA IDSW sMOTA
CAR 85.08 % 85.63 % 86.42 % 462 71.82 %
PEDESTRIAN 46.98 % 64.59 % 48.15 % 270 24.61 %

Benchmark MT rate PT rate ML rate FRAG
CAR 80.92 % 16.61 % 2.46 % 599
PEDESTRIAN 29.90 % 51.20 % 18.90 % 1554

Benchmark # Dets # Tracks
CAR 33727 1205
PEDESTRIAN 18109 1009

This table as LaTeX


This figure as: png pdf

This figure as: png pdf

[1] J. Luiten, A. Os̆ep, P. Dendorfer, P. Torr, A. Geiger, L. Leal-Taixé, B. Leibe: HOTA: A Higher Order Metric for Evaluating Multi-object Tracking. IJCV 2020.
[2] K. Bernardin, R. Stiefelhagen: Evaluating Multiple Object Tracking Performance: The CLEAR MOT Metrics. JIVP 2008.
[3] Y. Li, C. Huang, R. Nevatia: Learning to associate: HybridBoosted multi-target tracker for crowded scene. CVPR 2009.


eXTReMe Tracker