Method

Multipurpose Deep Decoder Deconvolution Network [MultiNet]
https://github.com/MarvinTeichmann/KittiSeg#kittiseg

Submitted on 17 Jun. 2016 20:50 by
Marvin Teichmann (University of Cambridge)

Running time:0.17 s
Environment:GPU @ 2.5 Ghz (Python + C/C++)

Method Description:
An adapted deconvolution approach based on VGG as encoder and FCN as decoder. The model is implemented in python using Tensorflow.
Parameters:
Latex Bibtex:
@article{DBLP:journals/corr/TeichmannWZCU16,
author = {Marvin Teichmann and
Michael Weber and
J. Marius Zoellner and
Roberto Cipolla and
Raquel Urtasun},
title = {MultiNet: Real-time Joint Semantic Reasoning for Autonomous Driving},
journal = {CoRR},
volume = {abs/1612.07695},
year = {2016},
url = {http://arxiv.org/abs/1612.07695},
timestamp = {Mon, 02 Jan 2017 11:09:15 +0100},
biburl = {http://dblp.uni-trier.de/rec/bib/journals/corr/TeichmannWZCU16},
bibsource = {dblp computer science bibliography, http://dblp.org}
}

Evaluation in Bird's Eye View


Benchmark MaxF AP PRE REC FPR FNR
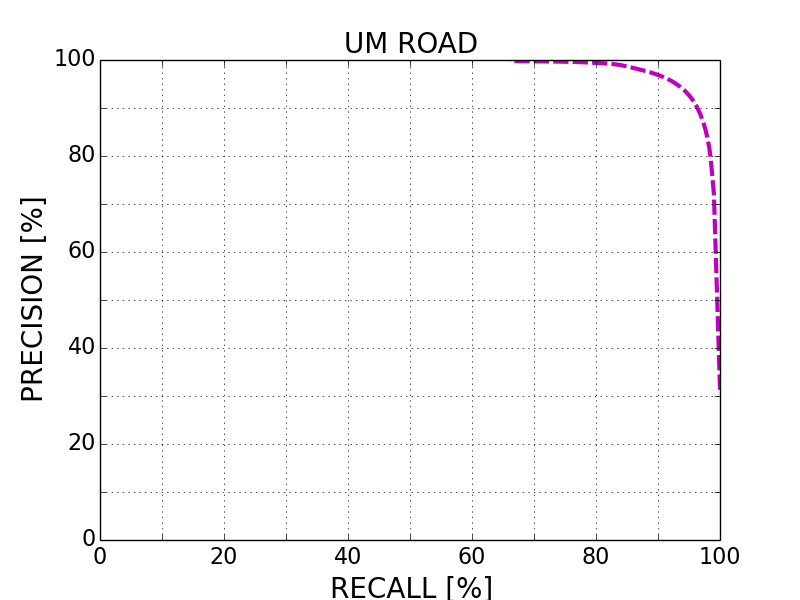
UM_ROAD 93.99 % 93.24 % 94.51 % 93.48 % 2.47 % 6.52 %
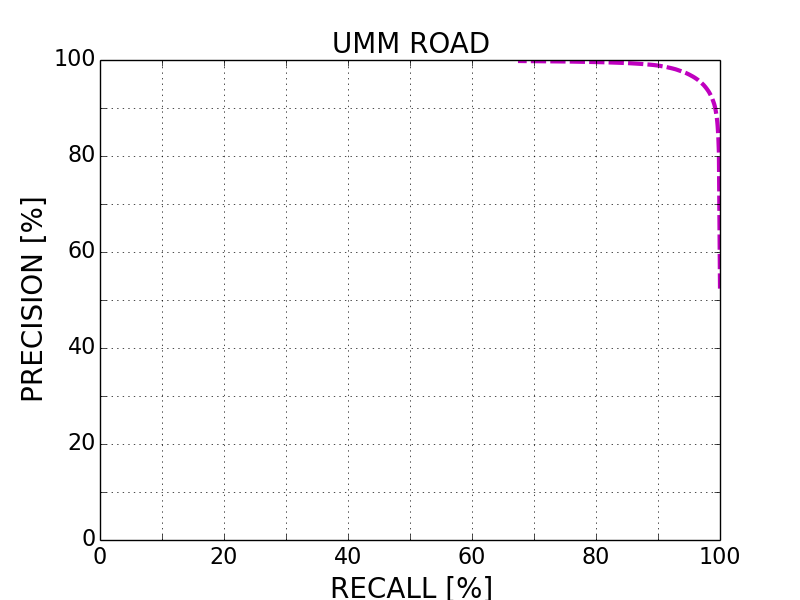
UMM_ROAD 96.15 % 95.36 % 95.79 % 96.51 % 4.67 % 3.49 %
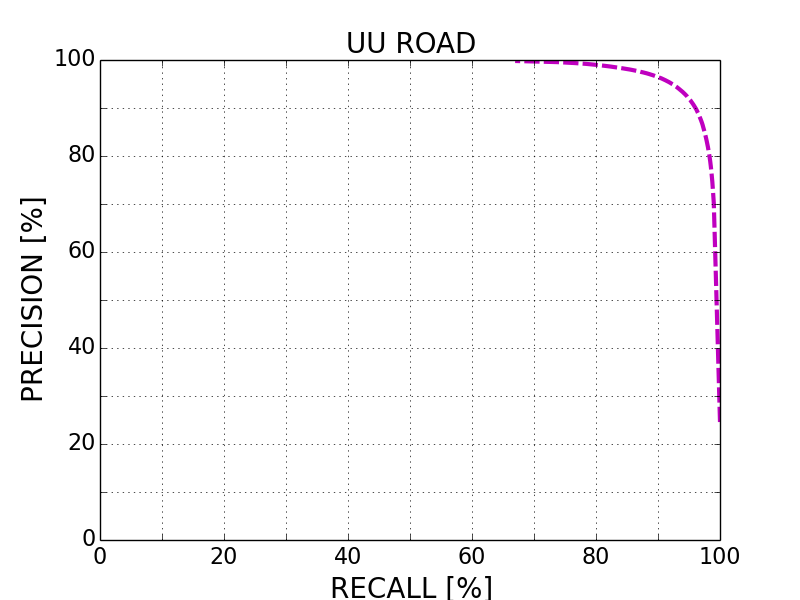
UU_ROAD 93.69 % 92.55 % 94.24 % 93.14 % 1.85 % 6.86 %
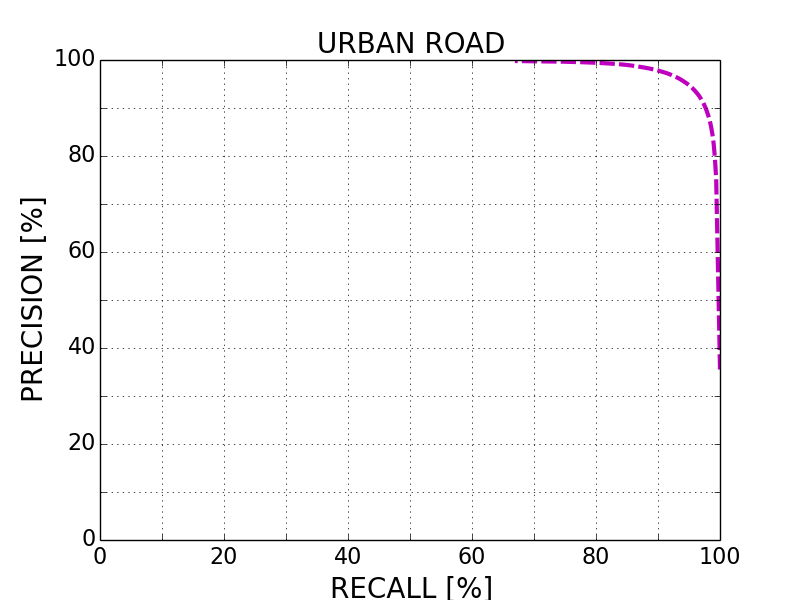
URBAN_ROAD 94.88 % 93.71 % 94.84 % 94.91 % 2.85 % 5.09 %
This table as LaTeX

Behavior Evaluation


Benchmark PRE-20 F1-20 HR-20 PRE-30 F1-30 HR-30 PRE-40 F1-40 HR-40
This table as LaTeX

Road/Lane Detection

The following plots show precision/recall curves for the bird's eye view evaluation.


This figure as: png eps pdf

This figure as: png eps pdf

This figure as: png eps pdf

This figure as: png eps pdf

Distance-dependent Behavior Evaluation

The following plots show the F1 score/Precision/Hitrate with respect to the longitudinal distance which has been used for evaluation.


Visualization of Results

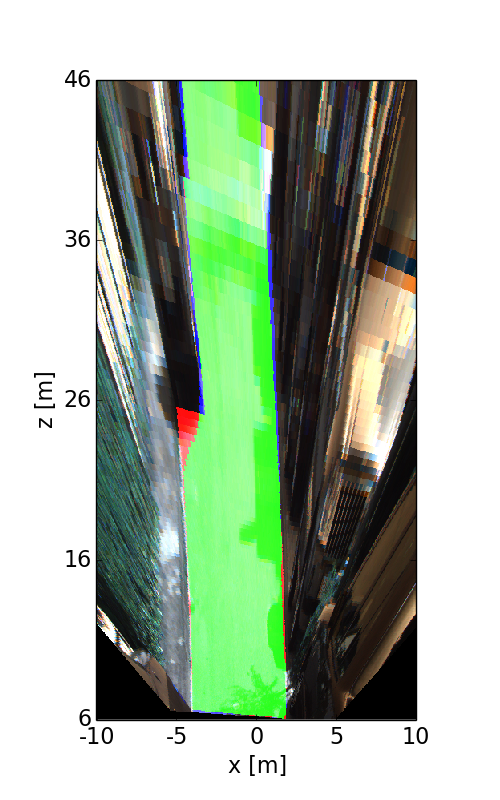
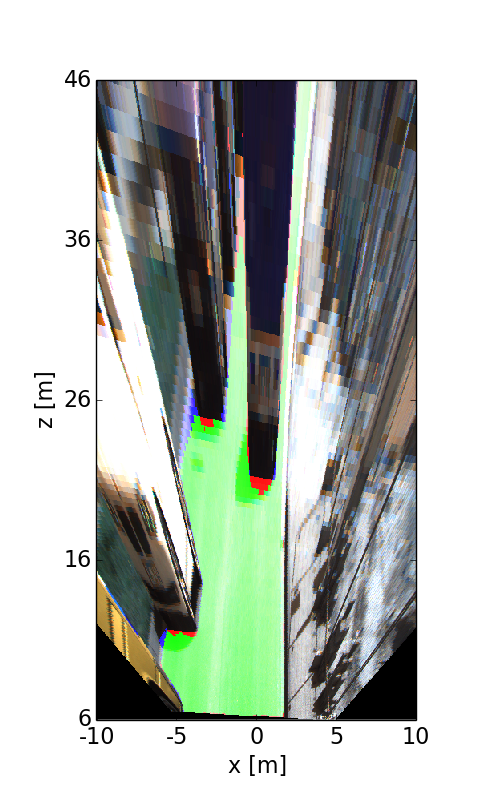
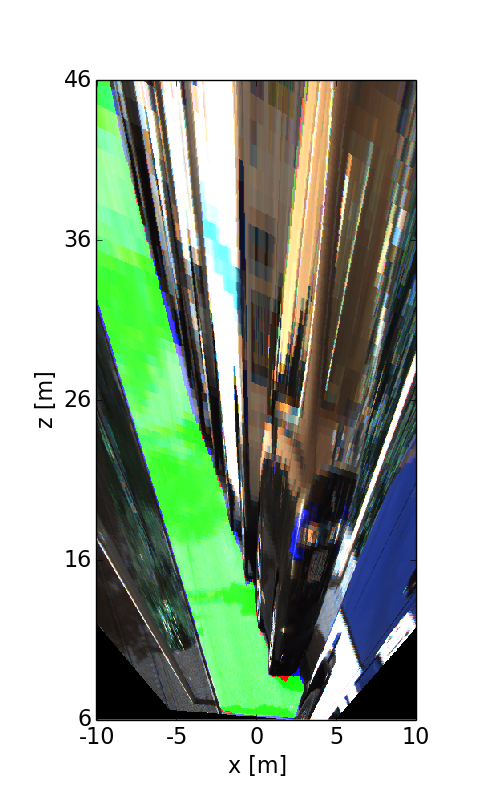
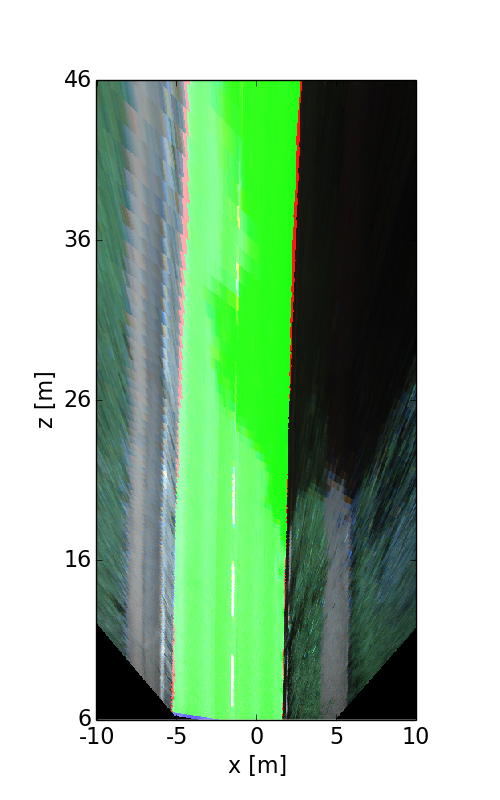
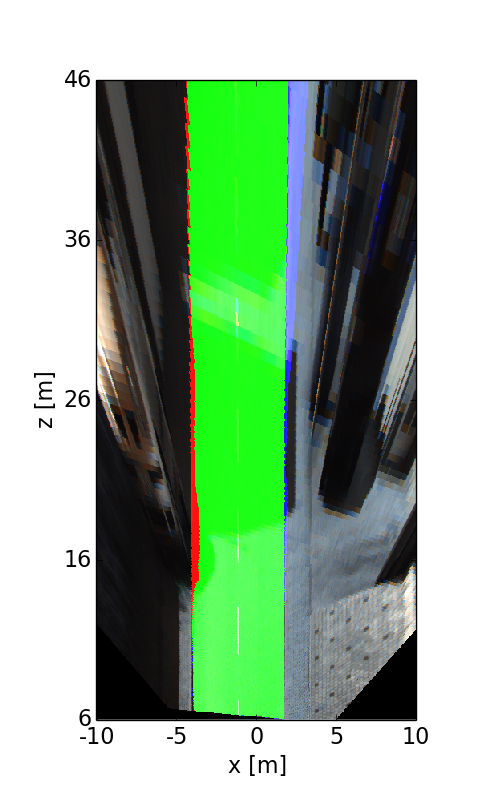
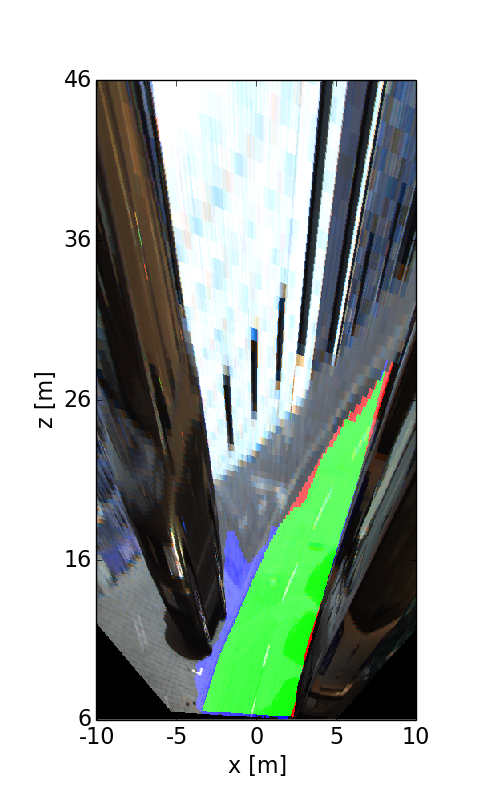
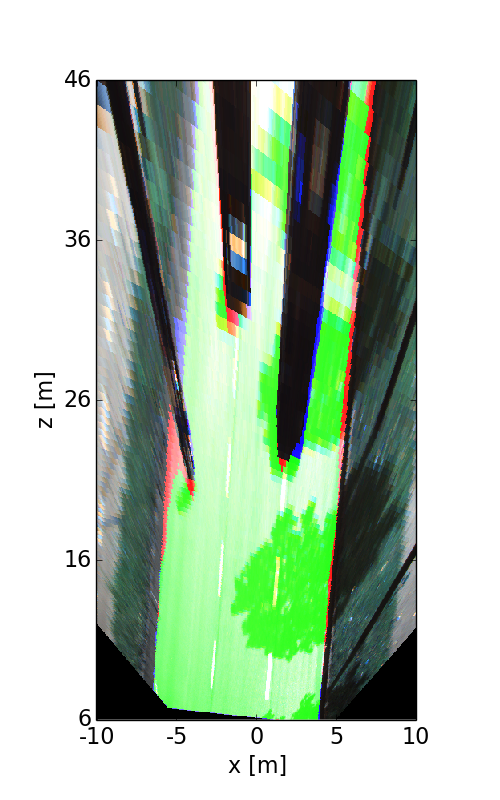
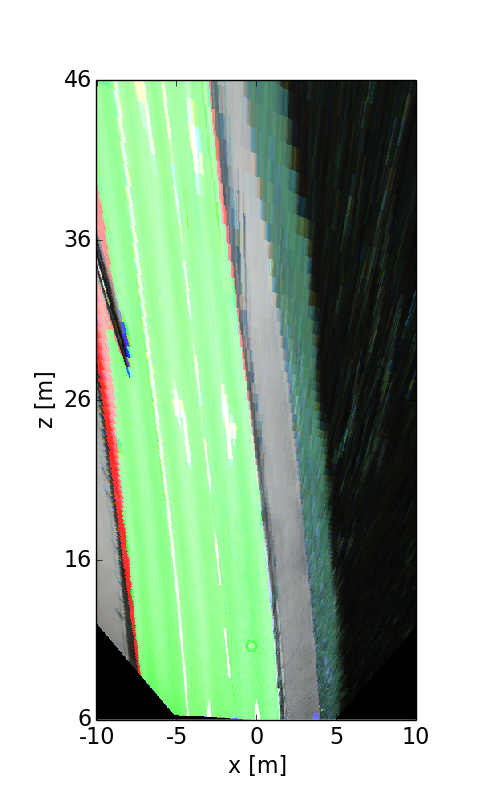
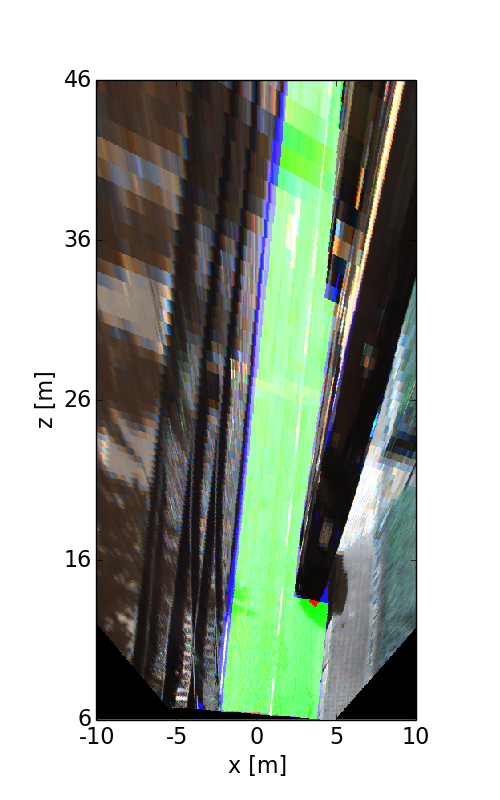
The following images illustrate the performance of the method qualitatively on a couple of test images. We first show results in the perspective image, followed by evaluation in bird's eye view. Here, red denotes false negatives, blue areas correspond to false positives and green represents true positives.


This figure as: png

This figure as: png

This figure as: png

This figure as: png

This figure as: png

This figure as: png

This figure as: png

This figure as: png

This figure as: png

This figure as: png

This figure as: png

This figure as: png

This figure as: png

This figure as: png

This figure as: png

This figure as: png

This figure as: png

This figure as: png


eXTReMe Tracker