Method

ChipNet: Real-Time LiDAR based Drivable Region Segmentation on an FPGA[la] [ChipNet]


Submitted on 30 Apr. 2018 14:28 by
Lin Bai (Worcester Polytechnic Institute)

Running time:12 ms
Environment:GPU @ 1.5 Ghz (Keras)

Method Description:
Real-Time Road Segmentation Using LiDAR Data
Processing on an FPGA [la] [ms]
Parameters:
Adam: 1e-5
Latex Bibtex:
@ARTICLE{8580596,
author={Y. {Lyu} and L. {Bai} and X. {Huang}},
journal={IEEE Transactions on Circuits and
Systems I: Regular Papers},
title={ChipNet: Real-Time LiDAR Processing for
Drivable Region Segmentation on an FPGA},
year={2019},
volume={66},
number={5},
pages={1769-1779},
keywords={cameras;field programmable gate
arrays;image scanners;image segmentation;learning
(artificial intelligence);neural nets;optical
radar;radar computing;radar imaging;radar
receivers;real-time LiDAR processing;field-
programmable gate array design;convolutional
neural network;autonomous vehicles;camera
data;LiDAR sensor;FPGA design;light detection and
ranging;semantic segmentation algorithm;drivable
region segmentation algorithms;CNN;3D geometry
information;KITTI road detection benchmarks;Ford
road detection benchmarks;time 17.59 ms;Laser
radar;Roads;Field programmable gate
arrays;Feature extraction;Three-dimensional
displays;Real-time systems;Measurement by laser
beam;Autonomous vehicle;road
segmentation;CNN;LiDAR;FPGA},
doi={10.1109/TCSI.2018.2881162},
ISSN={},
month={May},}

Evaluation in Bird's Eye View


Benchmark MaxF AP PRE REC FPR FNR
UM_ROAD 93.73 % 87.62 % 93.25 % 94.21 % 3.11 % 5.79 %
UMM_ROAD 94.87 % 91.31 % 95.21 % 94.53 % 5.23 % 5.47 %
UU_ROAD 92.91 % 84.95 % 90.98 % 94.91 % 3.06 % 5.09 %
URBAN_ROAD 94.05 % 88.29 % 93.57 % 94.53 % 3.58 % 5.47 %
This table as LaTeX

Behavior Evaluation


Benchmark PRE-20 F1-20 HR-20 PRE-30 F1-30 HR-30 PRE-40 F1-40 HR-40
This table as LaTeX

Road/Lane Detection

The following plots show precision/recall curves for the bird's eye view evaluation.


Distance-dependent Behavior Evaluation

The following plots show the F1 score/Precision/Hitrate with respect to the longitudinal distance which has been used for evaluation.


Visualization of Results

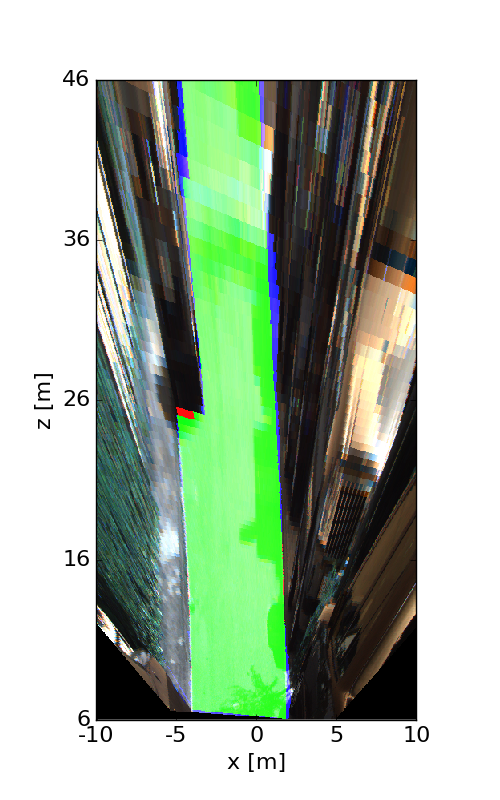
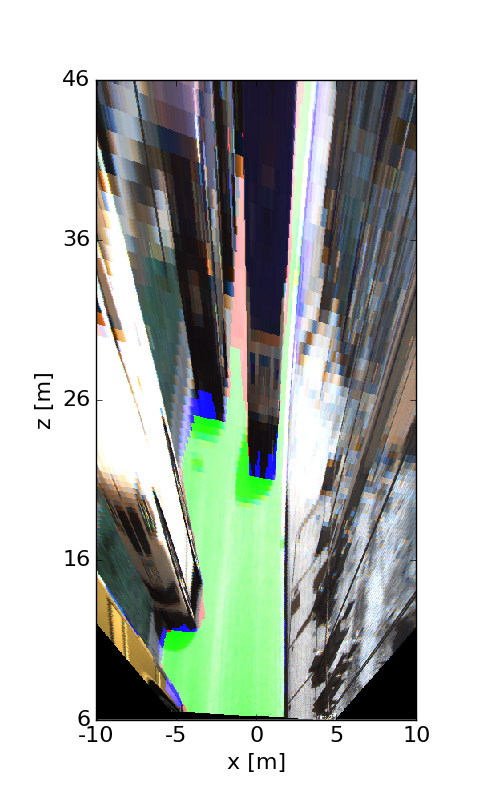
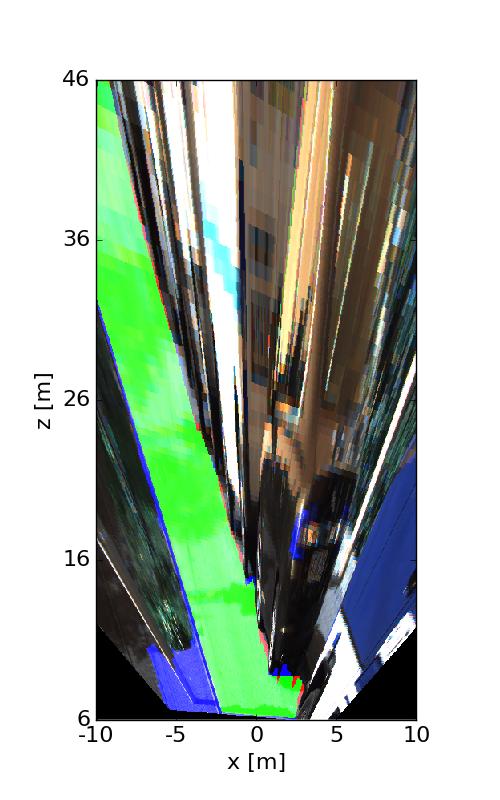
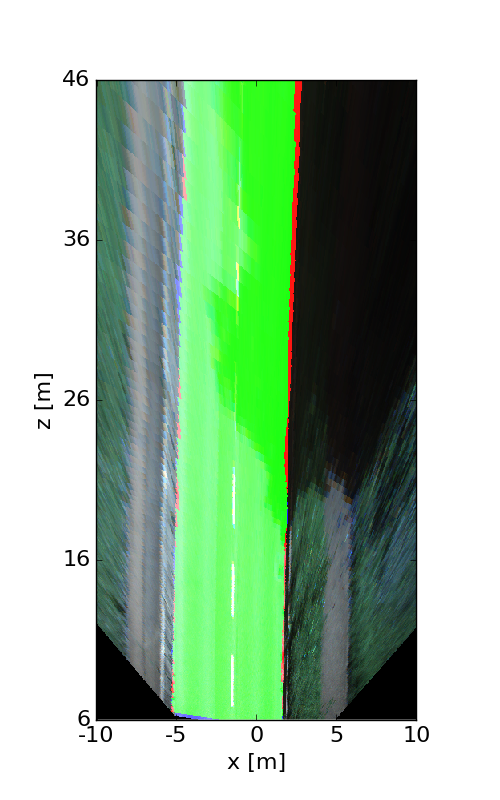
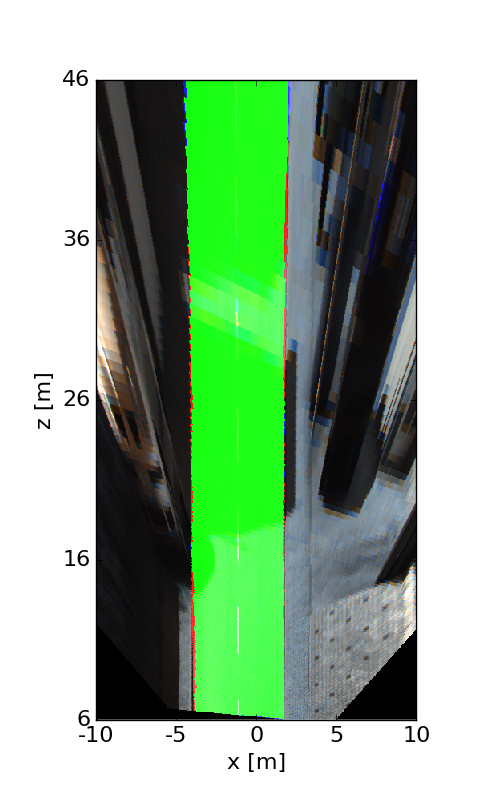
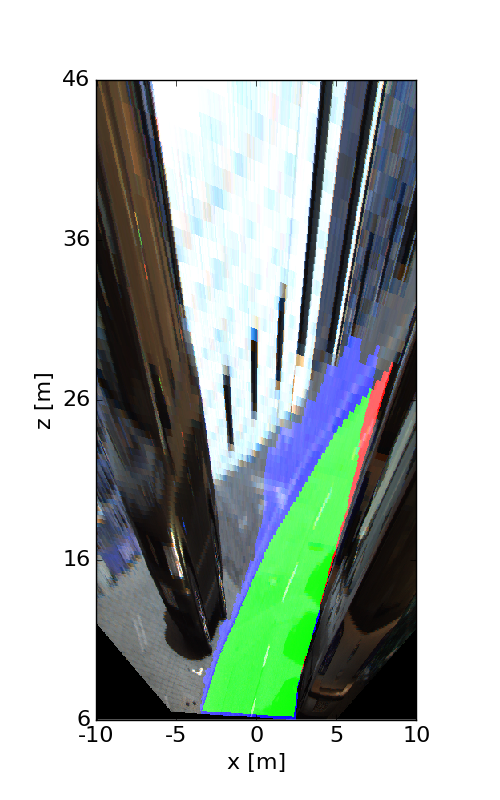
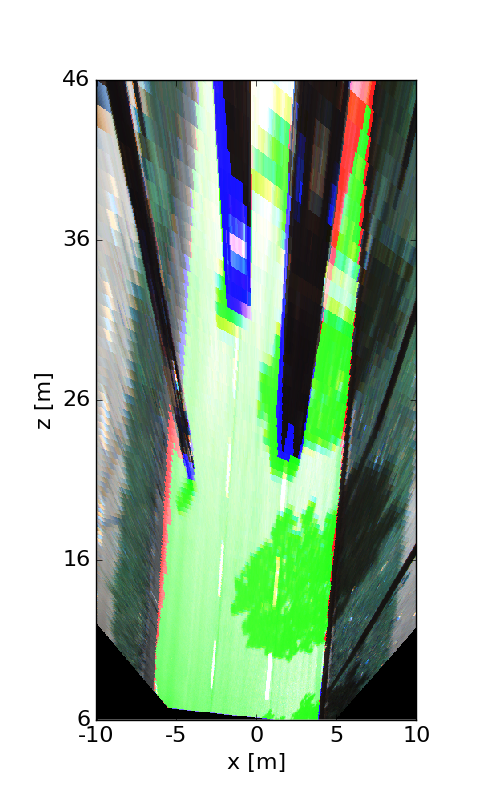
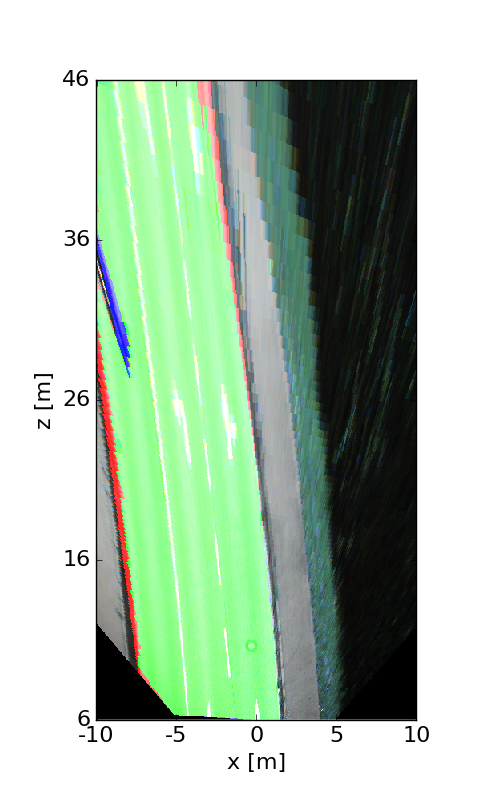
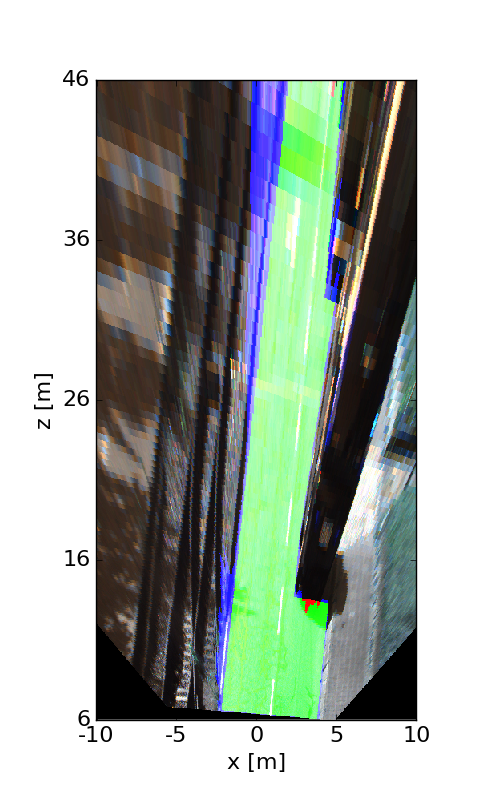
The following images illustrate the performance of the method qualitatively on a couple of test images. We first show results in the perspective image, followed by evaluation in bird's eye view. Here, red denotes false negatives, blue areas correspond to false positives and green represents true positives.


This figure as: png

This figure as: png

This figure as: png

This figure as: png

This figure as: png

This figure as: png

This figure as: png

This figure as: png

This figure as: png

This figure as: png

This figure as: png

This figure as: png

This figure as: png

This figure as: png

This figure as: png

This figure as: png

This figure as: png

This figure as: png


eXTReMe Tracker