Method

All Layers Output with Mathematical Morphology [ALO-AVG-MM]
https://github.com/falreis/segmentation-eval

Submitted on 14 Jan. 2019 13:04 by
Felipe Reis (PUC Minas)

Running time:0.0296 sec
Environment:GeForce GTX 1080 GPU (Python)

Method Description:
The method extracts side-outputs at different
layers of a network based on VGG16 architecture. We
added side outputs every layer. The outputs were
combined into a single result using a simple AVG
operation. The network was trained only for 500
epochs. A post-processing filtering based on
mathematical morphology idempotent functions is
also used in order to remove some undesirable
noises.
Parameters:
Parameters:
- SGD optimization;
- Learning rate: 1e-3;
- Decay: 5e-6;
- Momentum: 0.95;
- Image size: 624x192 pixels;
- Data augm.: 2601 training images
- Batch size: 16 images;
Latex Bibtex:
@INPROCEEDINGS{Reis:2019:IJCNN2019,
author={Felipe A. L. Reis and Raquel Almeida and
Ewa Kijak and Simon Malinowski and Silvio Jamil
F. Guimaraes and Zenilton K. G. do Patrocinio
Jr.},
booktitle={2019 International Joint Conference
on Neural Networks (IJCNN) - \textbf{Accepted}},
title={Combining convolutional side-outputs for
road image segmentation},
year={2019},
volume={},
number={},
pages={},
doi={},
ISSN={},
month={July},
}

Evaluation in Bird's Eye View


Benchmark MaxF AP PRE REC FPR FNR
UM_ROAD 91.15 % 83.82 % 89.07 % 93.33 % 5.22 % 6.67 %
UMM_ROAD 94.05 % 90.96 % 94.82 % 93.29 % 5.60 % 6.71 %
UU_ROAD 89.45 % 79.87 % 85.40 % 93.90 % 5.23 % 6.10 %
URBAN_ROAD 92.03 % 85.64 % 90.65 % 93.45 % 5.31 % 6.55 %
This table as LaTeX

Behavior Evaluation


Benchmark PRE-20 F1-20 HR-20 PRE-30 F1-30 HR-30 PRE-40 F1-40 HR-40
This table as LaTeX

Road/Lane Detection

The following plots show precision/recall curves for the bird's eye view evaluation.


Distance-dependent Behavior Evaluation

The following plots show the F1 score/Precision/Hitrate with respect to the longitudinal distance which has been used for evaluation.


Visualization of Results

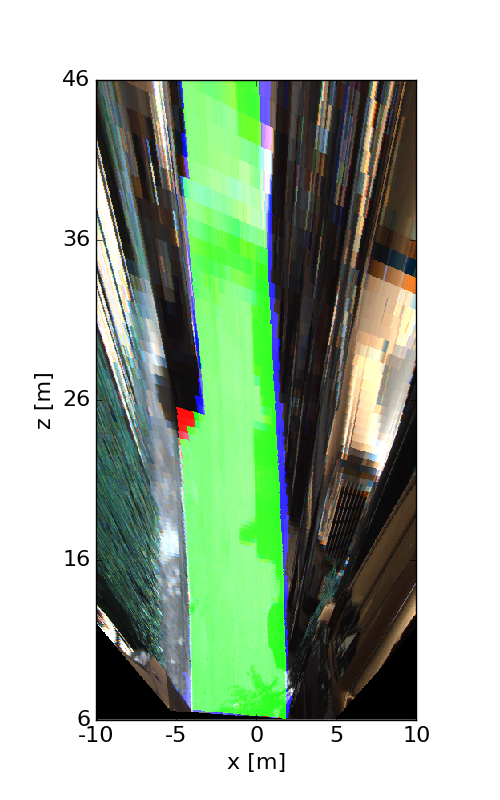
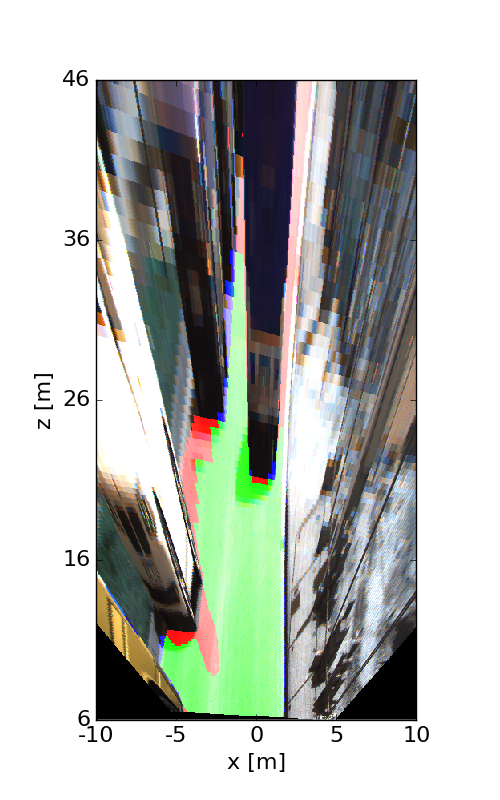
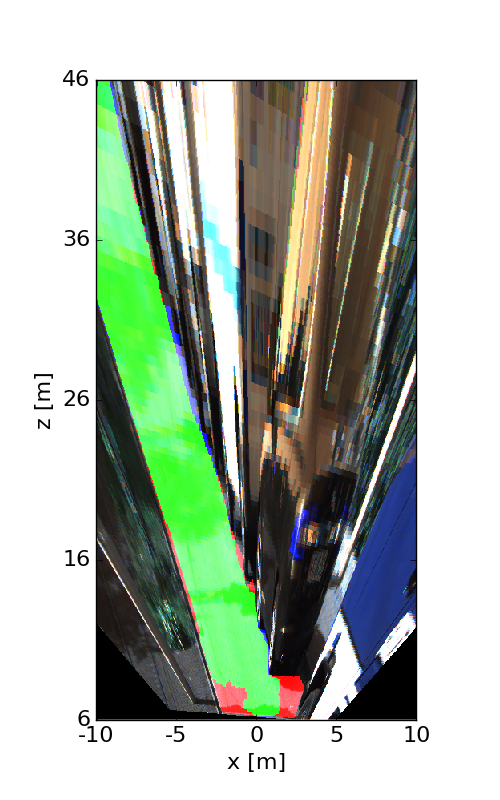
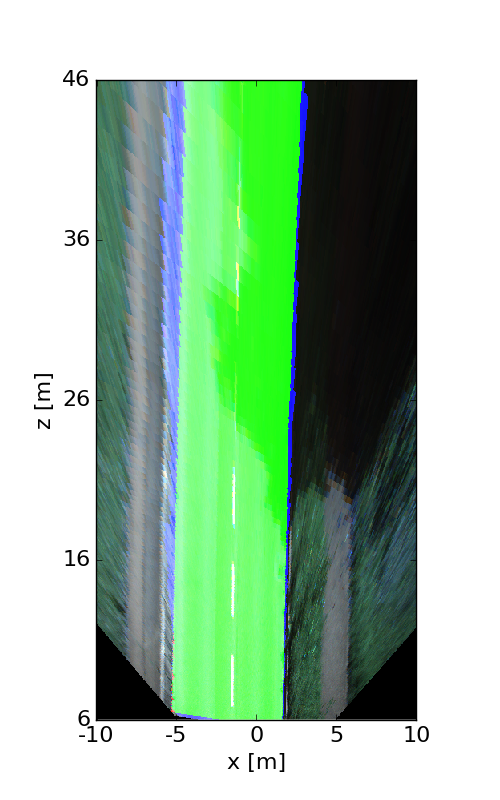
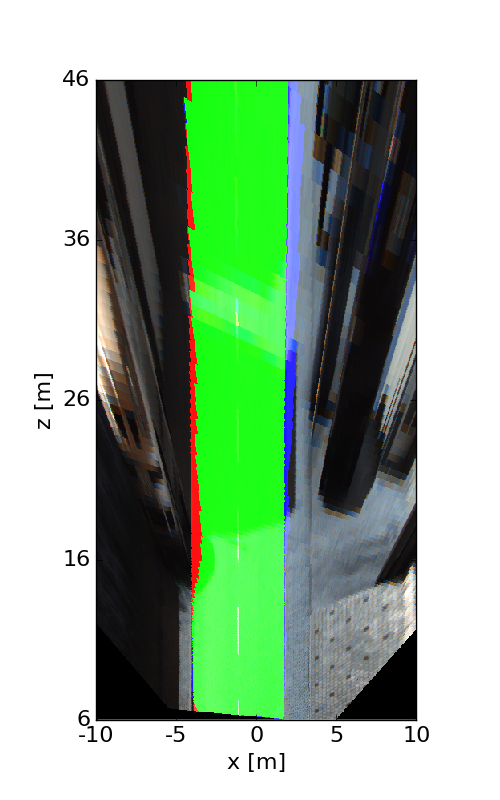
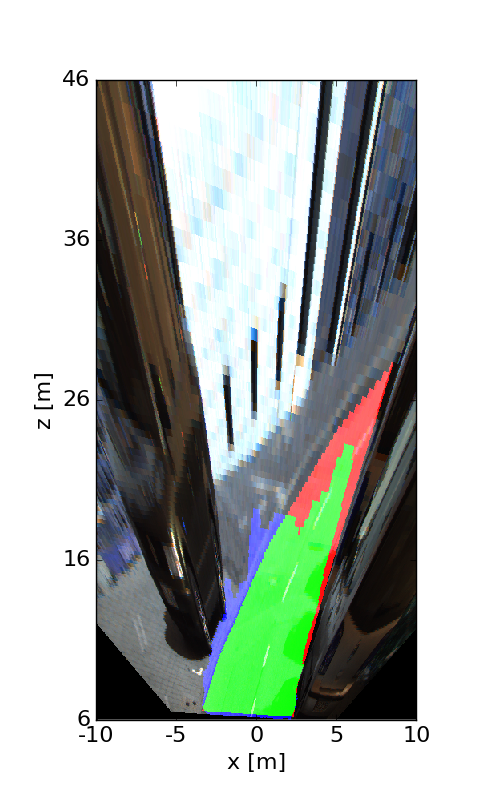
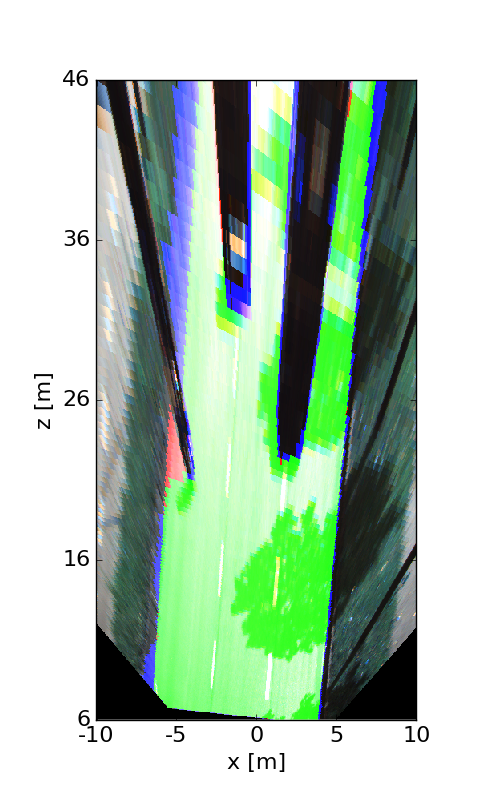
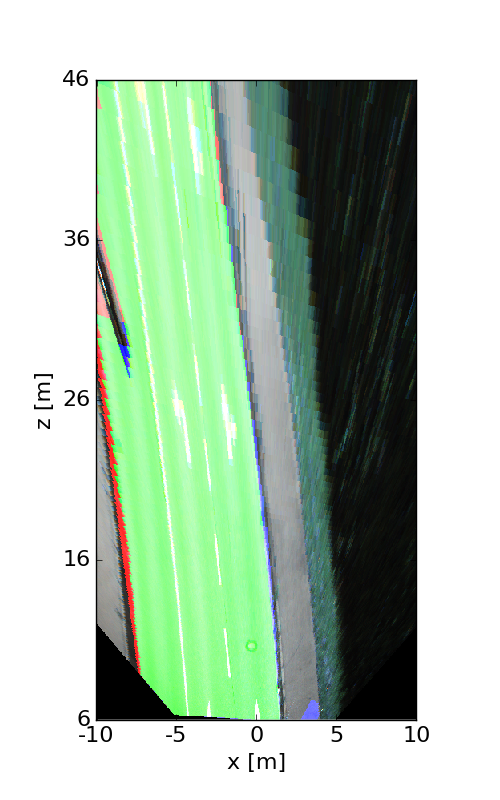
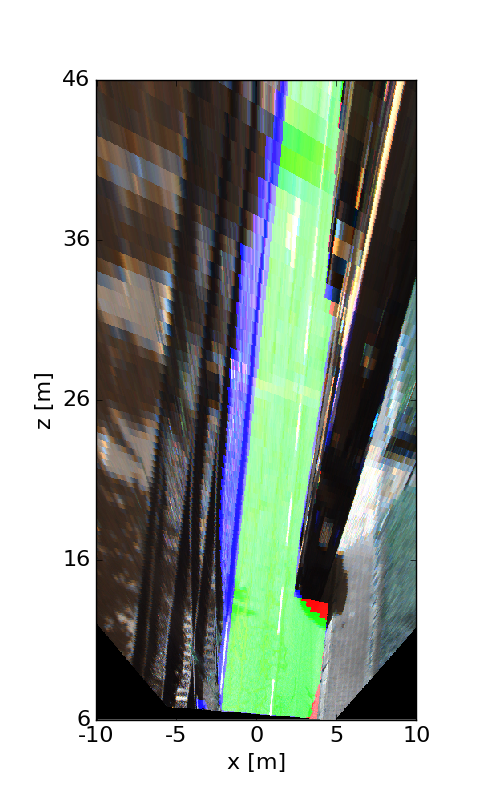
The following images illustrate the performance of the method qualitatively on a couple of test images. We first show results in the perspective image, followed by evaluation in bird's eye view. Here, red denotes false negatives, blue areas correspond to false positives and green represents true positives.


This figure as: png

This figure as: png

This figure as: png

This figure as: png

This figure as: png

This figure as: png

This figure as: png

This figure as: png

This figure as: png

This figure as: png

This figure as: png

This figure as: png

This figure as: png

This figure as: png

This figure as: png

This figure as: png

This figure as: png

This figure as: png


eXTReMe Tracker