

Method
Evaluation in Bird's Eye View
|
Behavior Evaluation
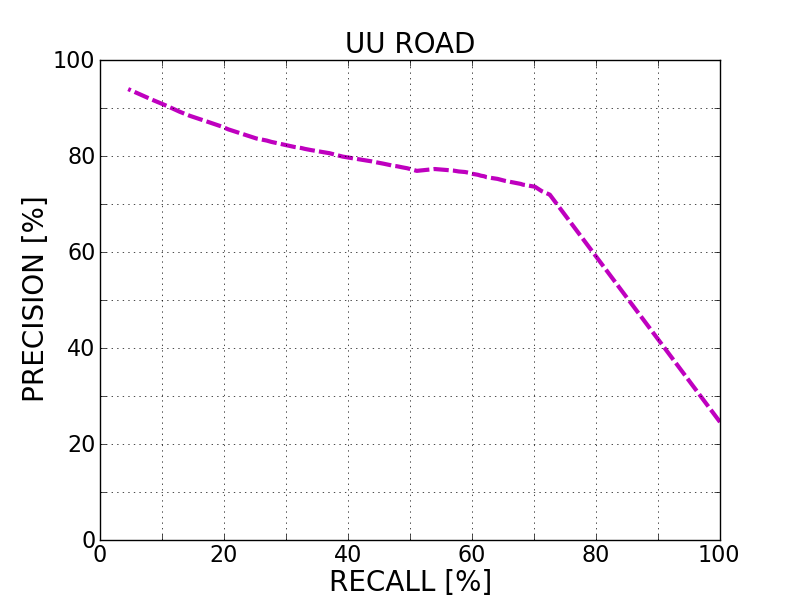
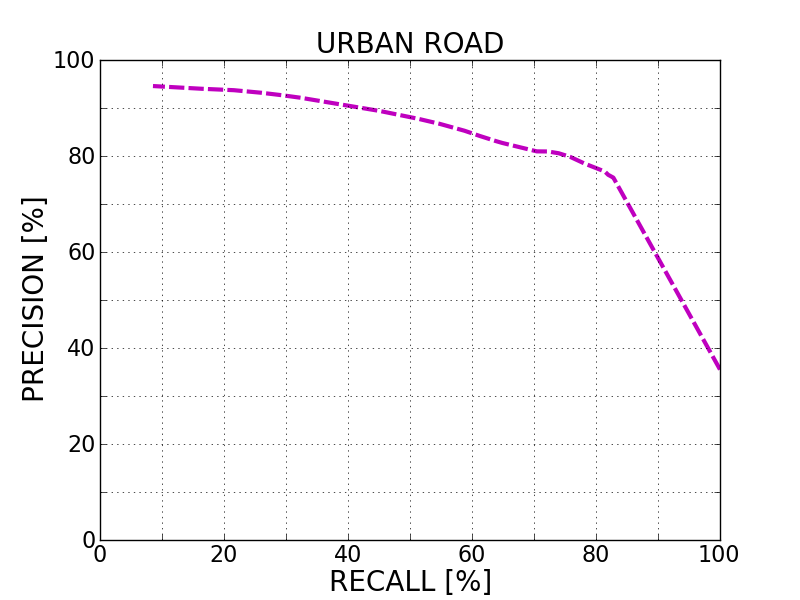
Road/Lane Detection
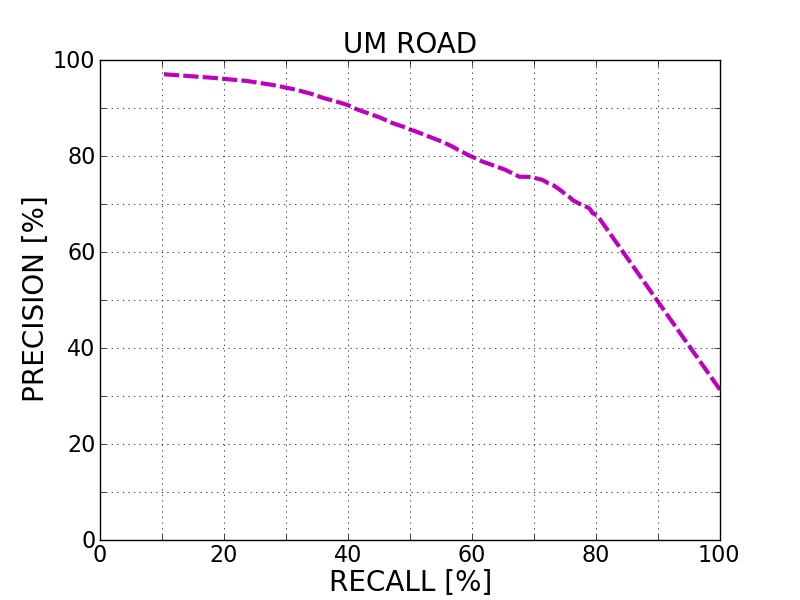
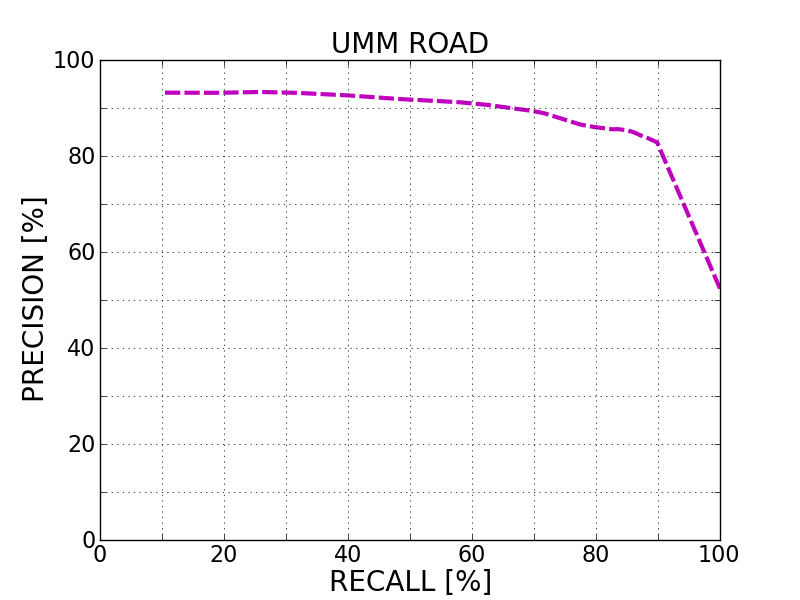
Distance-dependent Behavior Evaluation
The following plots show the F1 score/Precision/Hitrate with respect to the longitudinal distance which has been used for evaluation.
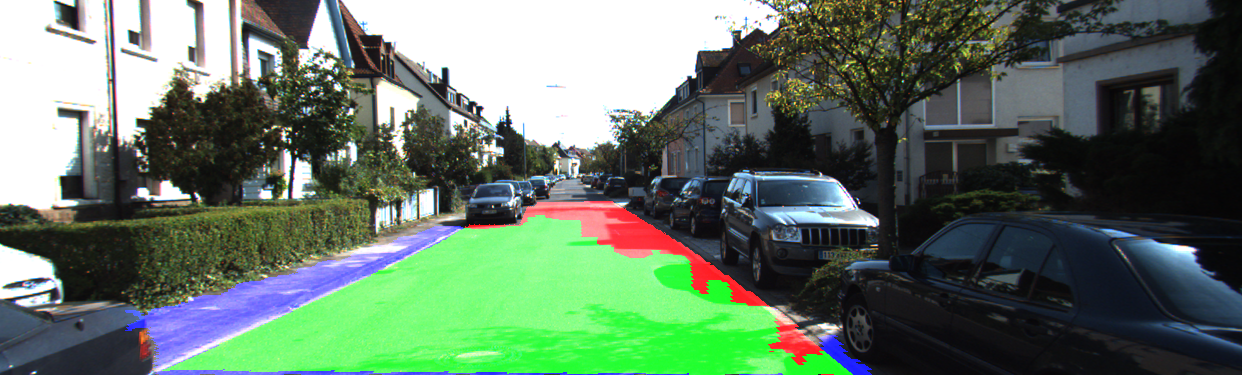
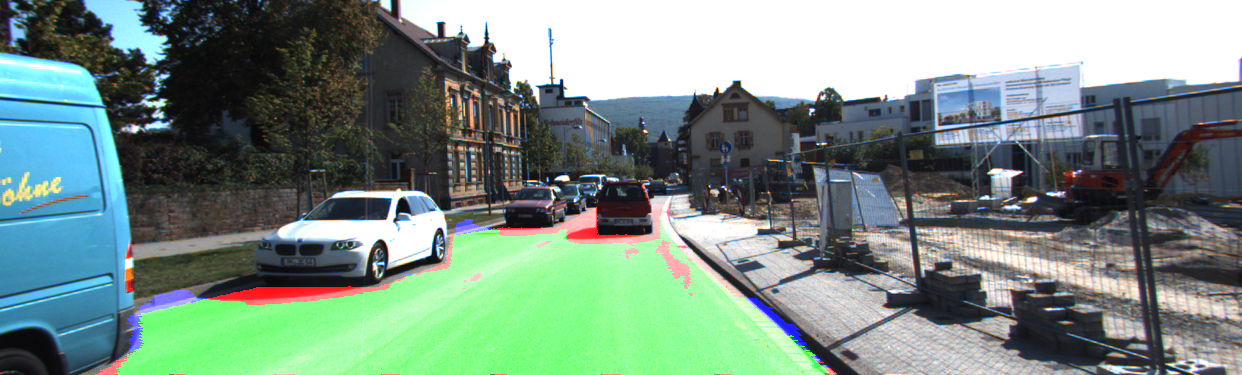
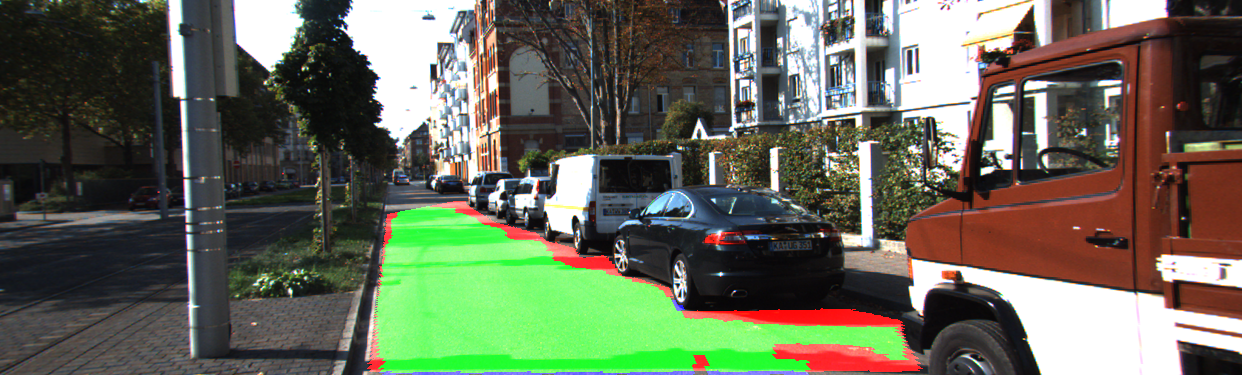
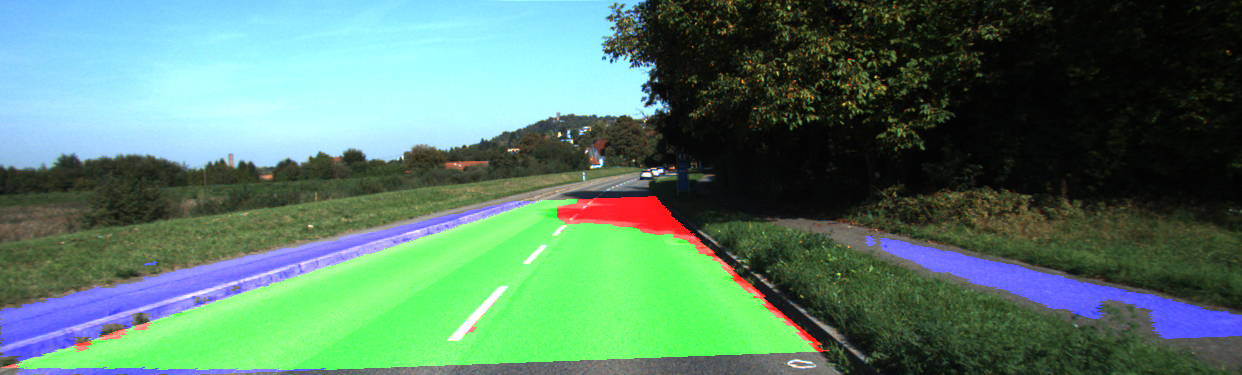
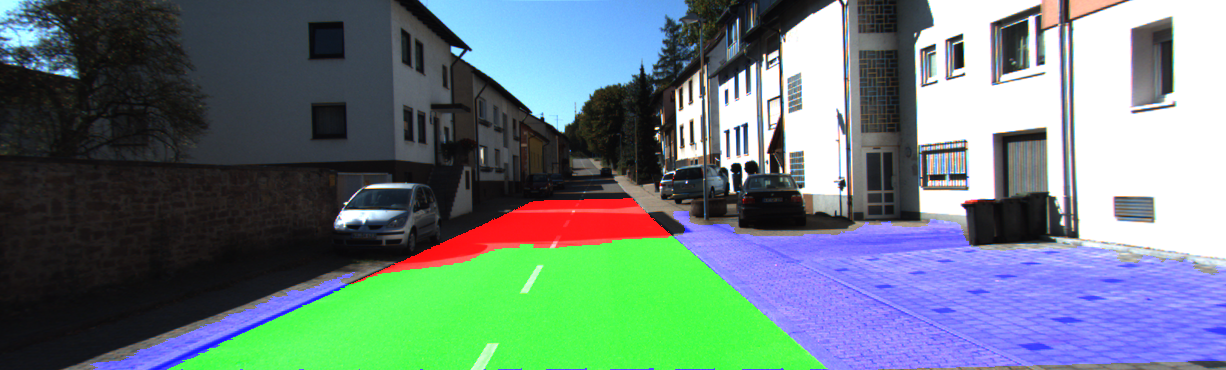
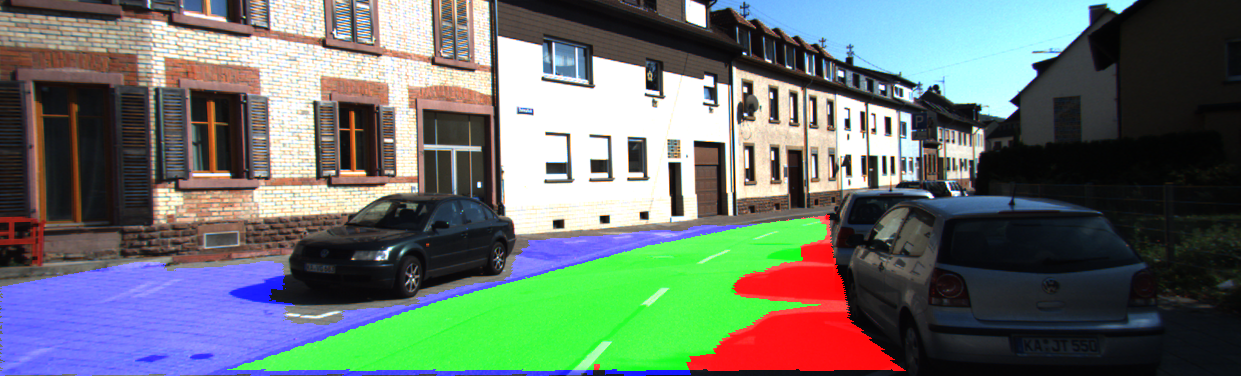
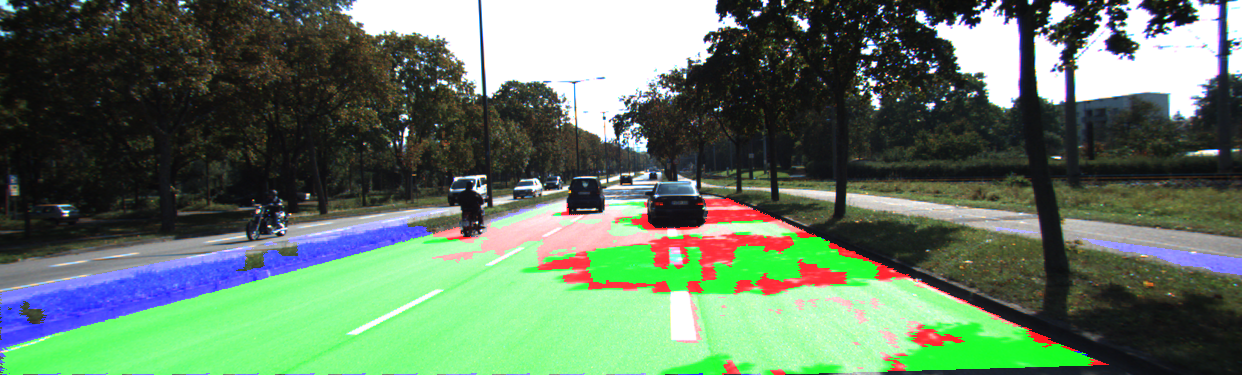
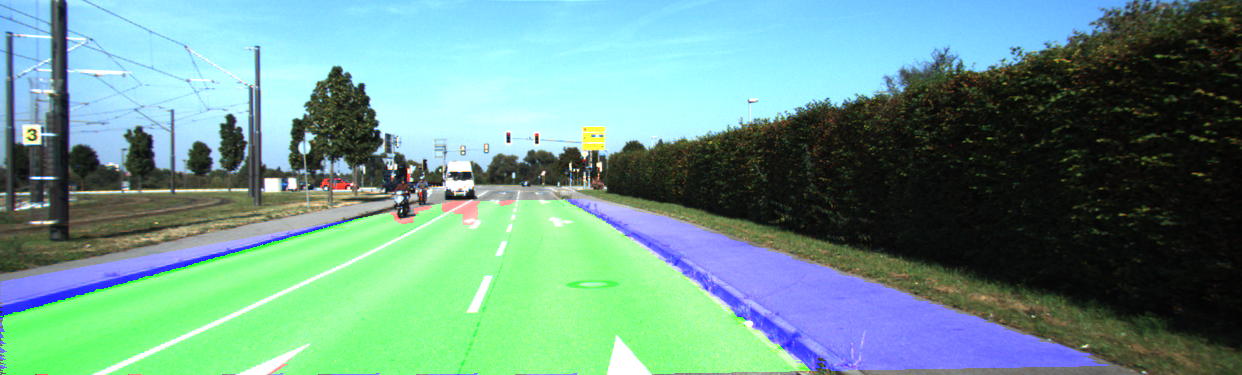
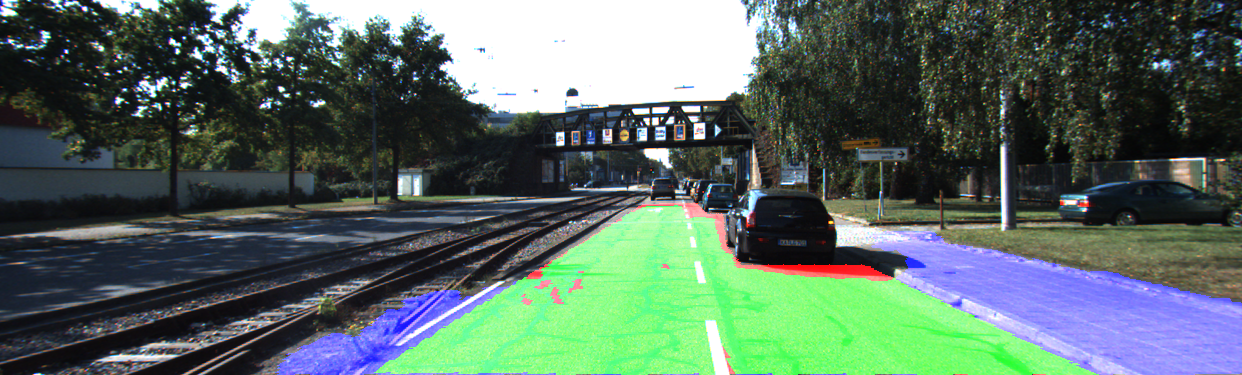
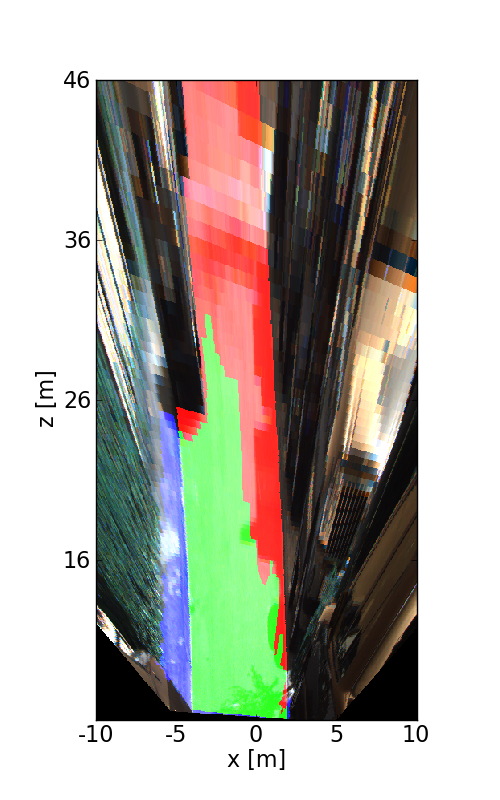
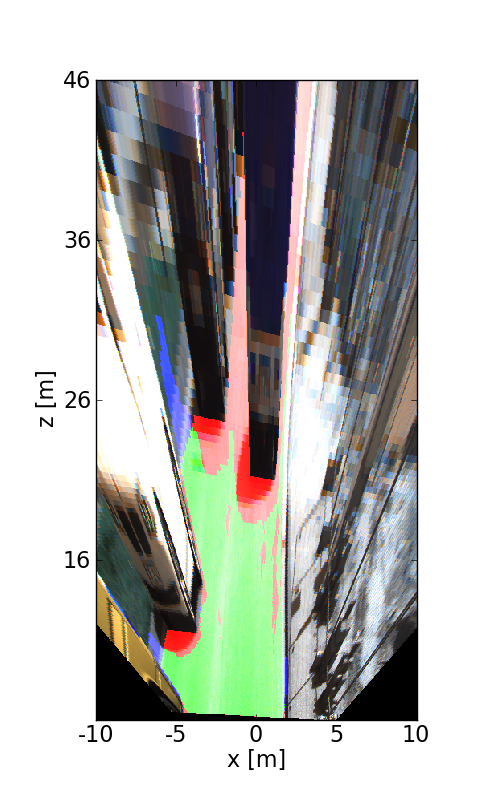
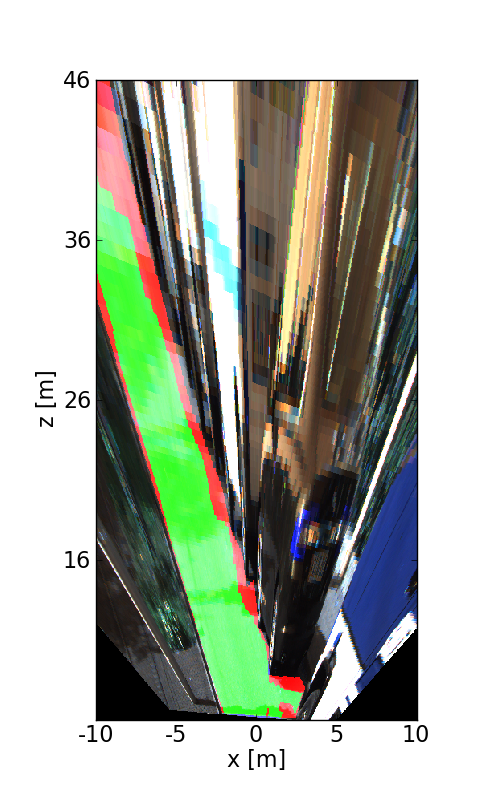
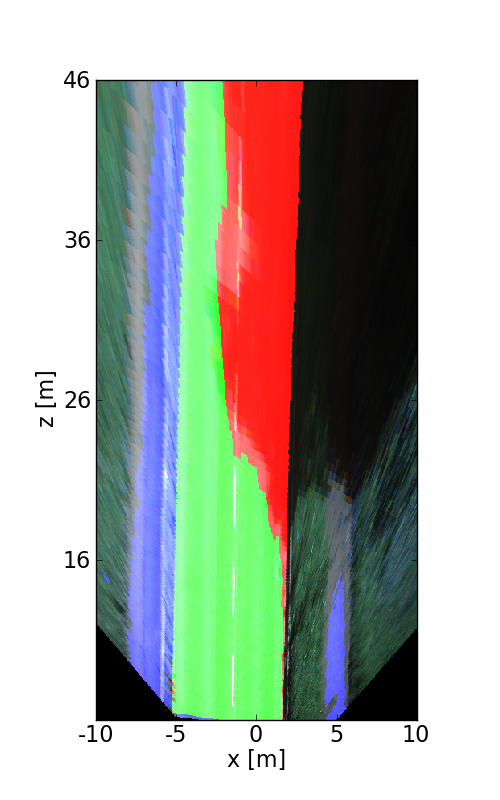
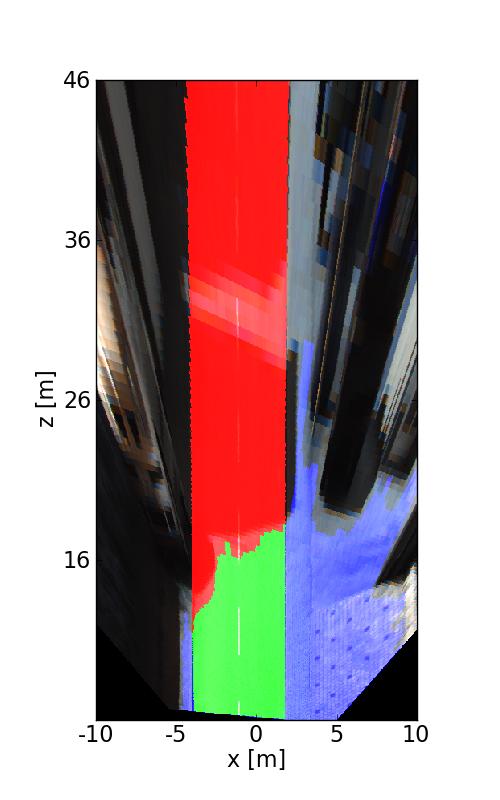
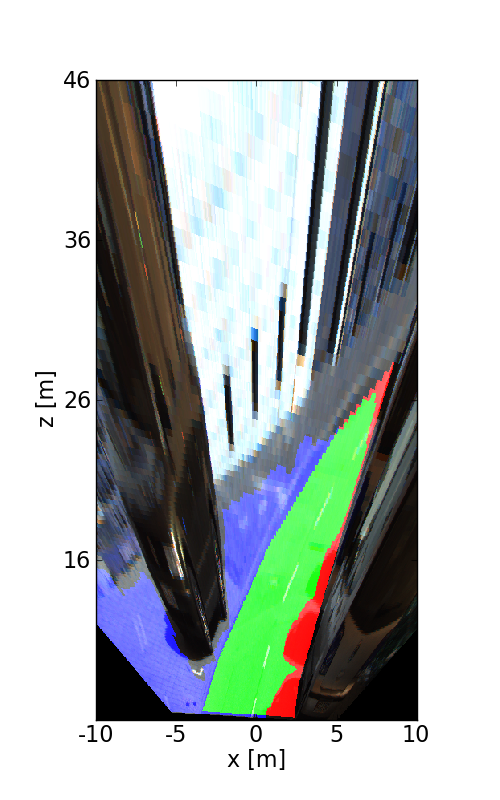
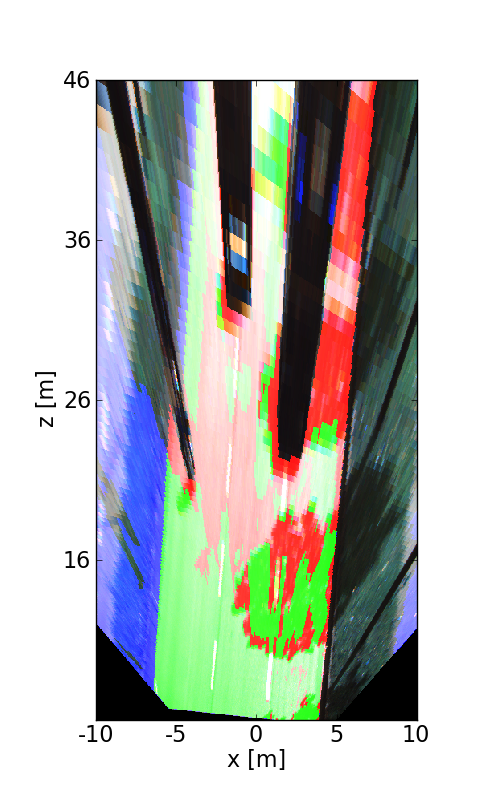
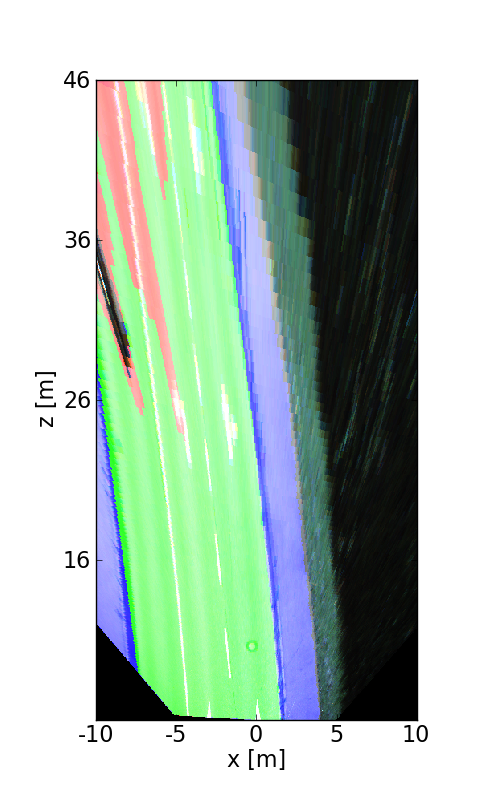
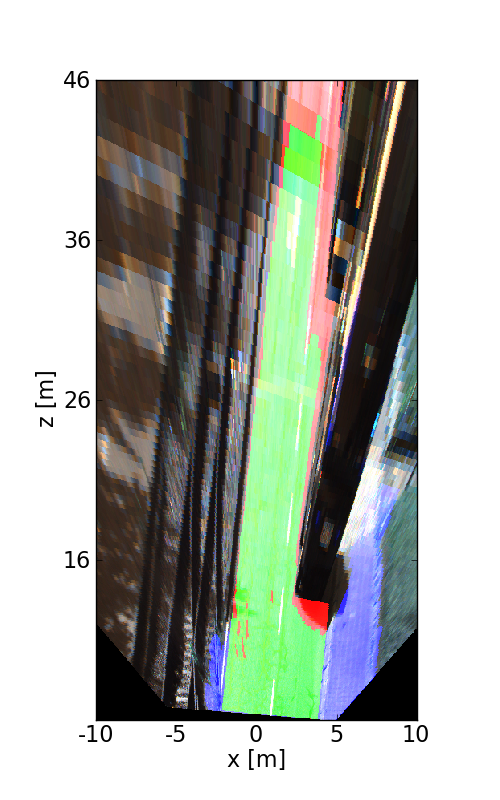
Visualization of Results
The following images illustrate the performance of the method qualitatively on a couple of test images. We first show results in the perspective image, followed by evaluation in bird's eye view. Here, red denotes false negatives, blue areas correspond to false positives and green represents true positives.