Method

Gaussain Process Regression based Robust Free Space Detection [st] [geo+gpr+crf]


Submitted on 26 Aug. 2016 10:02 by
Zhipeng Xiao (anu)

Running time:30 s
Environment:1 core @ 2.0 Ghz (C/C++)

Method Description:
Slanted plane stereo data as input, geometry based
free space detection using multiple feature fusion
and Gaussian process regression followed by crf
fusion.
Parameters:
\sigma=10

non-stationary covariance matrix:
\sigma_f=0.0618
\lambda=0.1268
\sigma_n=0.0496
Tmodel=0.04;
Tdata=3;
Latex Bibtex:

@article{doi:10.1177/1729881417717058,
author = {Zhipeng Xiao and Bin Dai and Hongdong Li
and Tao Wu and Xin Xu and Yujun Zeng and Tongtong
Chen},
title = {Gaussian process regression-based robust
free space detection for autonomous vehicle by 3-D
point cloud and 2-D appearance information fusion},
journal = {International Journal of Advanced
Robotic Systems},
volume = {14},
number = {4},
pages = {1729881417717058},
year = {2017},
doi = {10.1177/1729881417717058},

URL = {
http://dx.doi.org/10.1177/1729881417717058

},
eprint = {
http://dx.doi.org/10.1177/1729881417717058

},
}

Evaluation in Bird's Eye View


Benchmark MaxF AP PRE REC FPR FNR
UM_ROAD 85.13 % 72.24 % 81.33 % 89.29 % 9.34 % 10.71 %
UMM_ROAD 88.20 % 82.33 % 85.32 % 91.27 % 17.26 % 8.73 %
UU_ROAD 81.00 % 69.74 % 79.78 % 82.27 % 6.79 % 17.73 %
URBAN_ROAD 85.56 % 74.21 % 82.81 % 88.50 % 10.12 % 11.50 %
This table as LaTeX

Behavior Evaluation


Benchmark PRE-20 F1-20 HR-20 PRE-30 F1-30 HR-30 PRE-40 F1-40 HR-40
This table as LaTeX

Road/Lane Detection

The following plots show precision/recall curves for the bird's eye view evaluation.


Distance-dependent Behavior Evaluation

The following plots show the F1 score/Precision/Hitrate with respect to the longitudinal distance which has been used for evaluation.


Visualization of Results

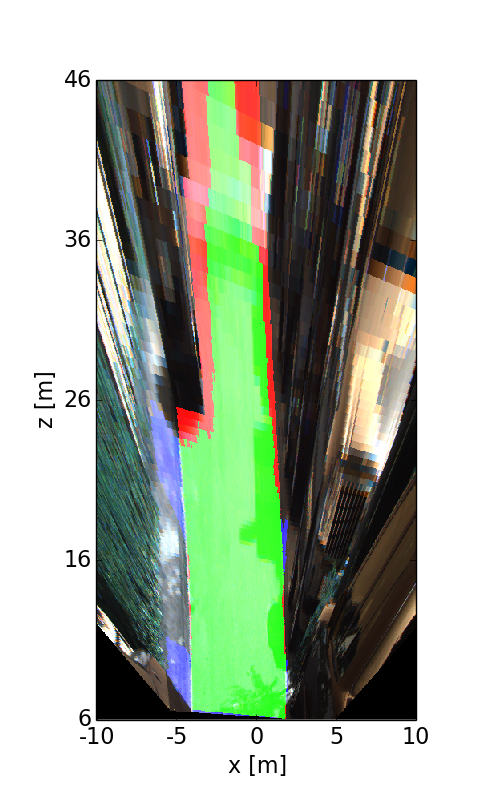
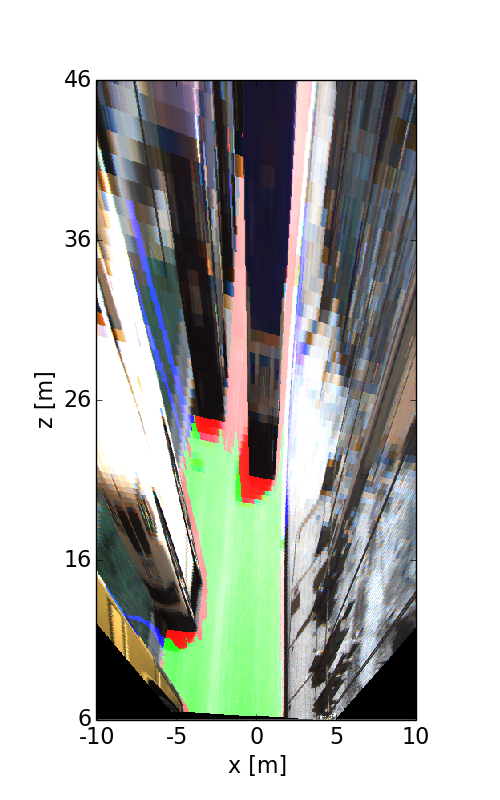
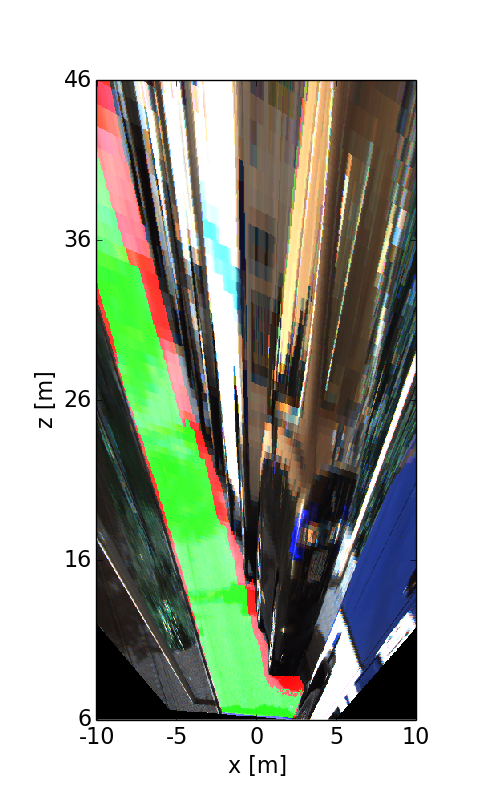
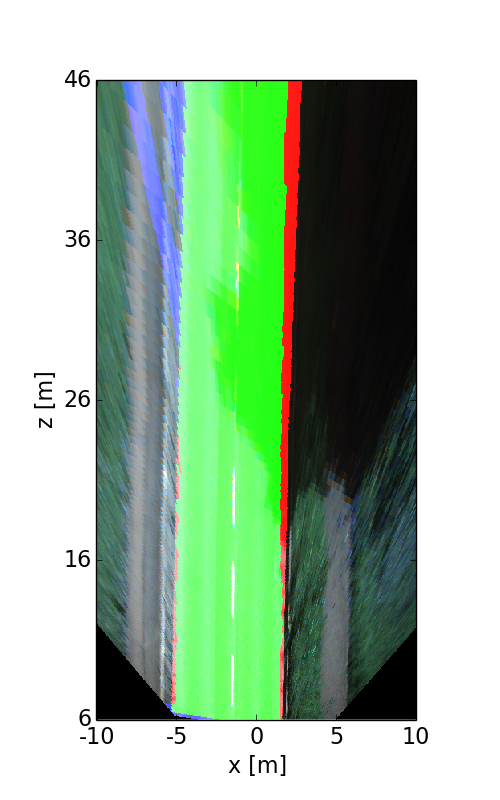
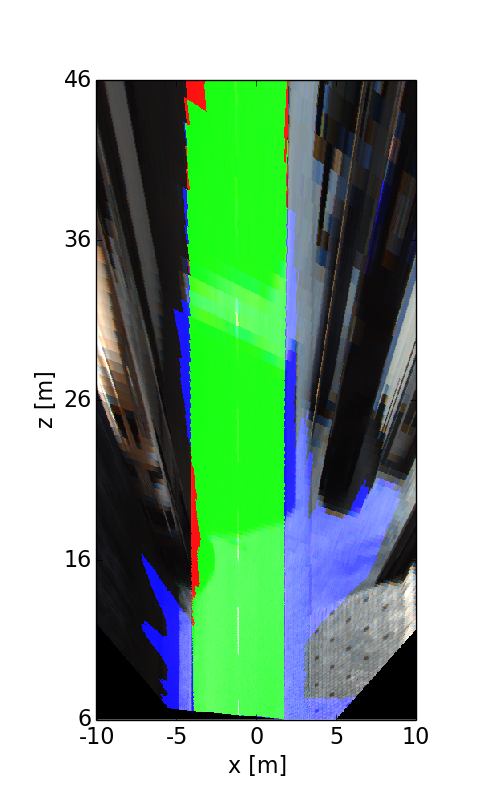
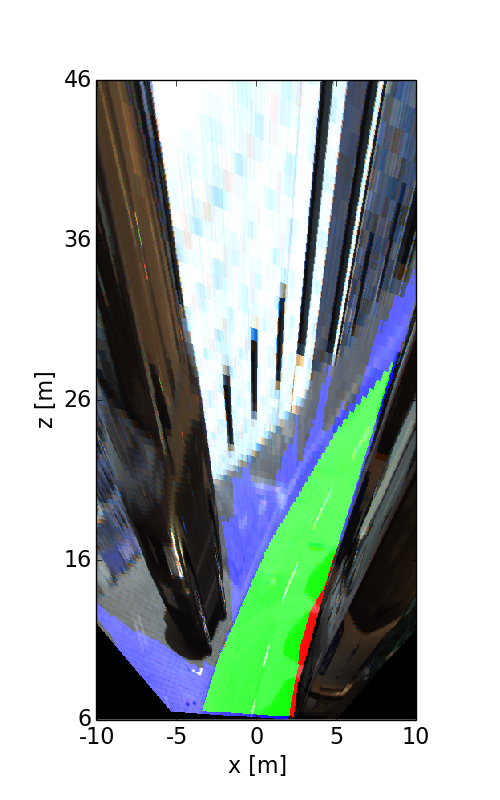
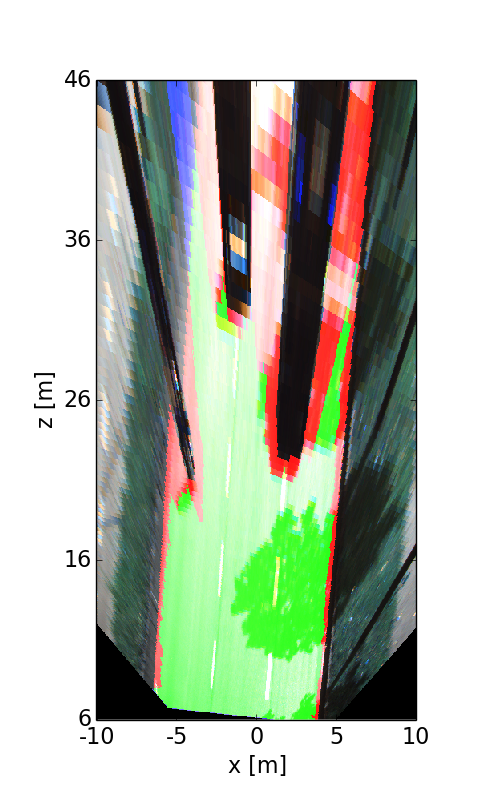
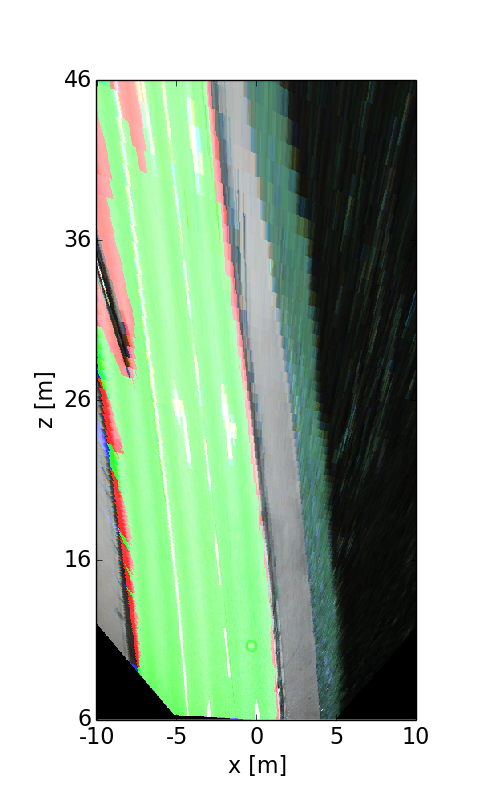
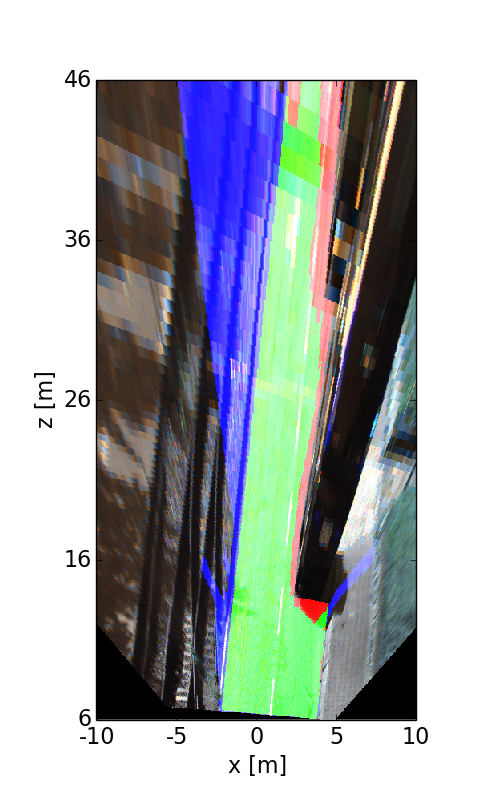
The following images illustrate the performance of the method qualitatively on a couple of test images. We first show results in the perspective image, followed by evaluation in bird's eye view. Here, red denotes false negatives, blue areas correspond to false positives and green represents true positives.


This figure as: png

This figure as: png

This figure as: png

This figure as: png

This figure as: png

This figure as: png

This figure as: png

This figure as: png

This figure as: png

This figure as: png

This figure as: png

This figure as: png

This figure as: png

This figure as: png

This figure as: png

This figure as: png

This figure as: png

This figure as: png


eXTReMe Tracker