Method

2D/3D Artificial Neural Network [st] [ANN]


Submitted on 24 May. 2014 09:55 by
Giovani Bernardes Vitor (Heudiasyc Laboratory)

Running time:3 s
Environment:1 core @ 3.0 Ghz (C/C++)

Method Description:
This method presents an approach for road detection based on image segmentation. This segmentation is resulted from merging 2D and 3D image processing data from a stereo vision system. The 2D layer returns a matrix containing
pixel’s clusters based on the Watershed transform. Whereas the 3D layer return labels, that are classified by the V-Disparity technique, to free spaces, obstacles and non-classified area. Thus, a feature’s descriptor for each cluster is composed with features from both layers. The road pattern recognition was performed by an artificial neural network, trained to obtain a final result from this feature’s descriptor.

(Some alterations from original code were done to adapt to this benchmark.)
Parameters:
\lambda=30
h = 3
Latex Bibtex:
@INPROCEEDINGS{Vitor2013IV,
author={Vitor, G. B. and Lima, D. A. and Victorino, A. C. and Ferreira, J. V.},
booktitle={Intelligent Vehicles Symposium (IV), 2013 IEEE},
title={A 2D/3D Vision Based Approach Applied to Road Detection in Urban Environments},
year={2013},
keywords={Road Detection; Computer Vision; Image Segmentation; Watershed Transform; V-Disparity Map.},
pages={952-957}
}

Evaluation in Bird's Eye View


Benchmark MaxF AP PRE REC FPR FNR
UM_ROAD 62.83 % 46.77 % 50.21 % 83.91 % 37.91 % 16.09 %
UMM_ROAD 80.95 % 68.36 % 69.95 % 96.05 % 45.35 % 3.95 %
UU_ROAD 54.07 % 36.61 % 39.28 % 86.69 % 43.67 % 13.31 %
URBAN_ROAD 67.70 % 52.50 % 54.19 % 90.17 % 41.98 % 9.83 %
This table as LaTeX

Behavior Evaluation


Benchmark PRE-20 F1-20 HR-20 PRE-30 F1-30 HR-30 PRE-40 F1-40 HR-40
This table as LaTeX

Road/Lane Detection

The following plots show precision/recall curves for the bird's eye view evaluation.


Distance-dependent Behavior Evaluation

The following plots show the F1 score/Precision/Hitrate with respect to the longitudinal distance which has been used for evaluation.


Visualization of Results

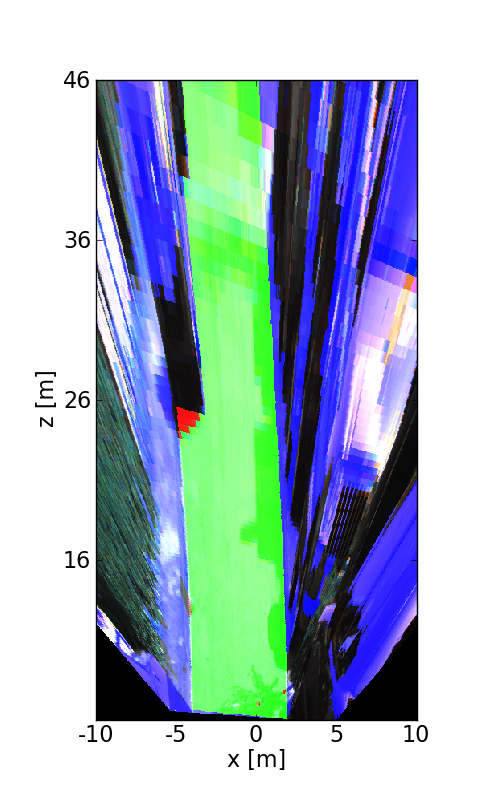
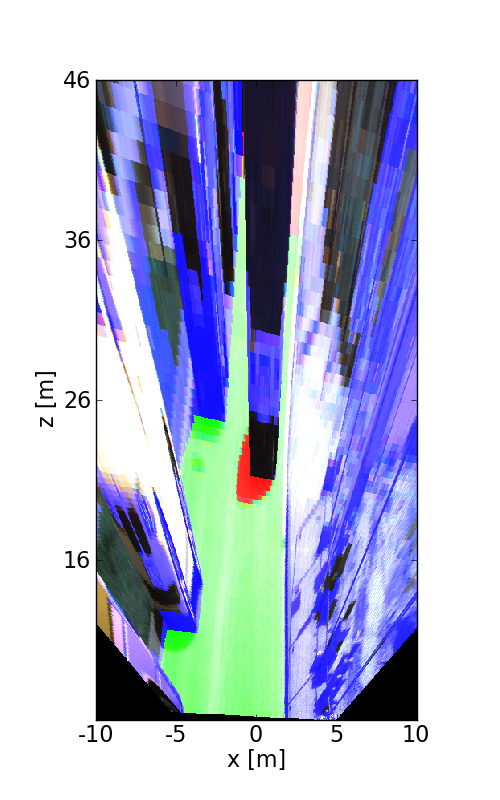
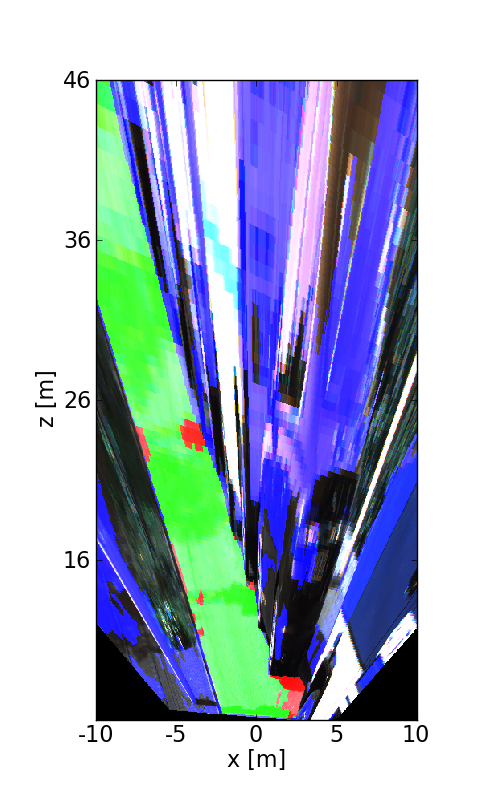
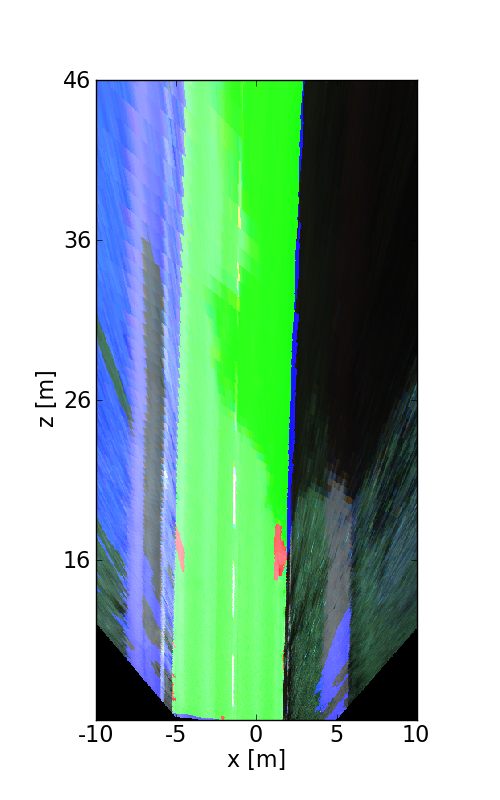
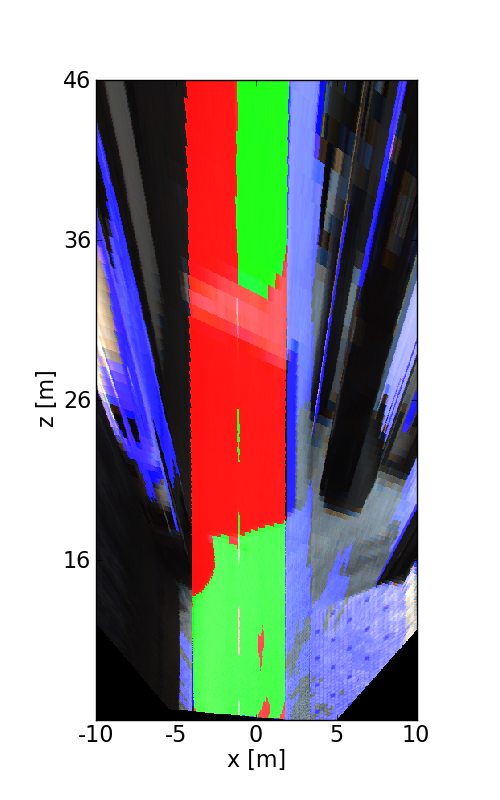
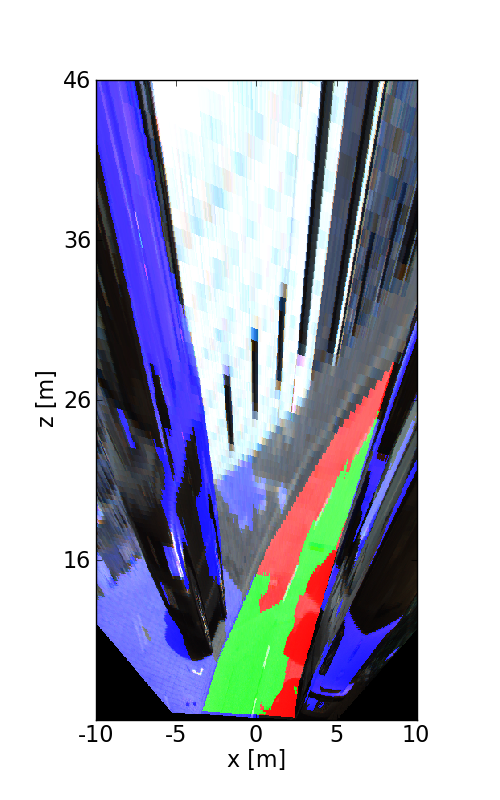
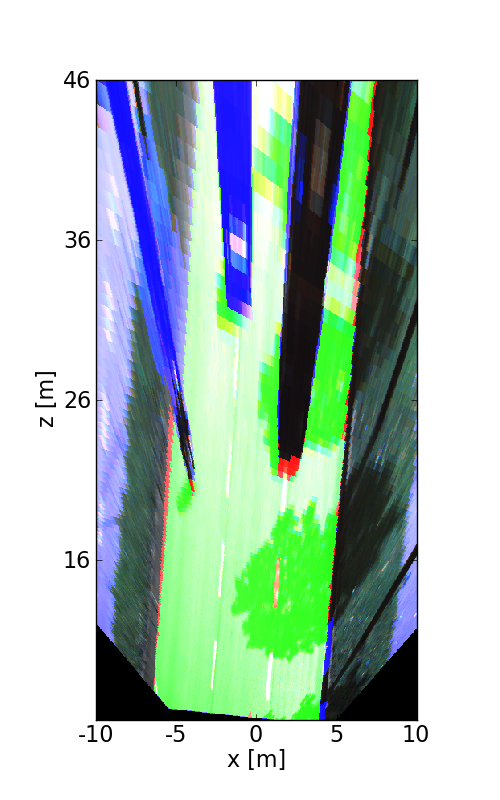
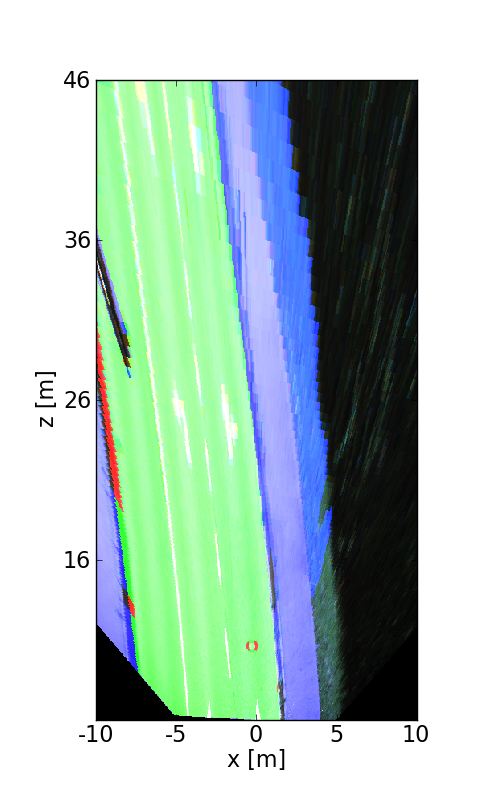
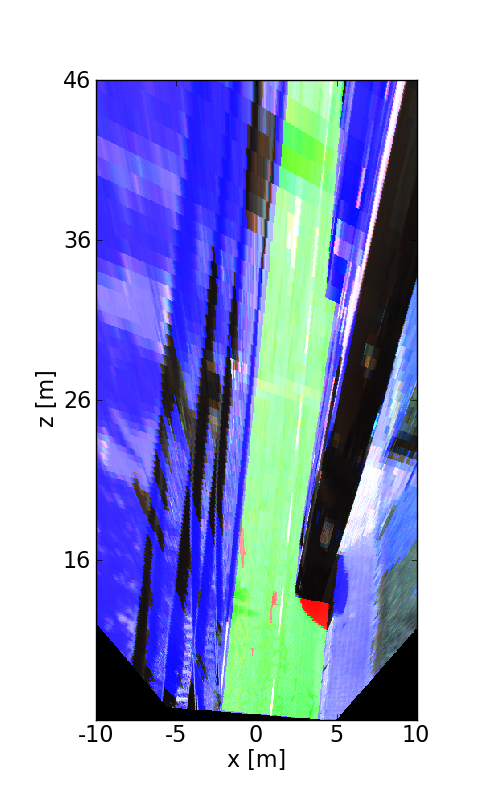
The following images illustrate the performance of the method qualitatively on a couple of test images. We first show results in the perspective image, followed by evaluation in bird's eye view. Here, red denotes false negatives, blue areas correspond to false positives and green represents true positives.


This figure as: png

This figure as: png

This figure as: png

This figure as: png

This figure as: png

This figure as: png

This figure as: png

This figure as: png

This figure as: png

This figure as: png

This figure as: png

This figure as: png

This figure as: png

This figure as: png

This figure as: png

This figure as: png

This figure as: png

This figure as: png


eXTReMe Tracker