Method

Difference-driven Cross-modal RGB-D Road Segmentation Network [DCR-RoadSeg]


Submitted on 19 Nov. 2025 06:26 by
wenpu ma (Hohai University)

Running time:0.03 s
Environment:4 cores @ 2.5 Ghz (Python)

Method Description:
We propose a lightweight RGB-D road segmentation
scheme from three complementary dimensions: cross-
modal feature rectification, high-level context
modeling, and data-level robustness enhancement.
First, a Difference-driven Road-aware cross-modal
Feature Rectification Module (DR-FRM) is designed,
which explicitly captures the consensus and
disagreement between RGB and depth features. It
adaptively suppresses noisy modal features while
enhancing reliable ones across both channel and
spatial dimensions, thereby mitigating error
propagation caused by coarse-grained fusion.
Second, a Depthwise Large-kernel Pyramidal
Aggregation module (DLPA) is proposed, which
explicitly expands the effective receptive field
of high-level features with minimal additional
computational overhead, improving the modeling of
contextual information for long-range lane
markings, curves, and complex road topologies.
Third, the cross-dataset instance-level RGB-D
augmentation strategy introduced in Evi-RoadSeg is
use
Parameters:
lr=1e-4
weight_decay=1e-4
optimizer=AdamW
epochs=400
Latex Bibtex:

Evaluation in Bird's Eye View


Benchmark MaxF AP PRE REC FPR FNR
UM_ROAD 95.63 % 90.29 % 96.18 % 95.07 % 1.72 % 4.93 %
UMM_ROAD 96.88 % 93.70 % 97.83 % 95.94 % 2.33 % 4.06 %
UU_ROAD 95.64 % 88.79 % 95.21 % 96.07 % 1.58 % 3.93 %
URBAN_ROAD 96.20 % 91.13 % 96.70 % 95.71 % 1.80 % 4.29 %
This table as LaTeX

Behavior Evaluation


Benchmark PRE-20 F1-20 HR-20 PRE-30 F1-30 HR-30 PRE-40 F1-40 HR-40
This table as LaTeX

Road/Lane Detection

The following plots show precision/recall curves for the bird's eye view evaluation.


Distance-dependent Behavior Evaluation

The following plots show the F1 score/Precision/Hitrate with respect to the longitudinal distance which has been used for evaluation.


Visualization of Results

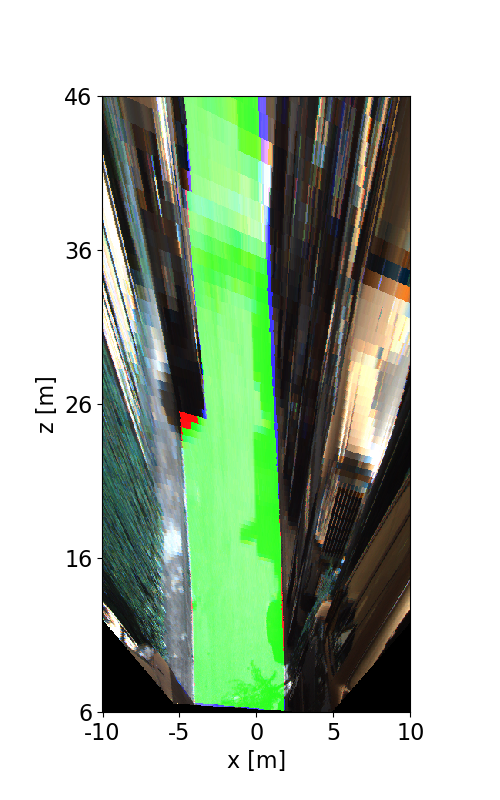
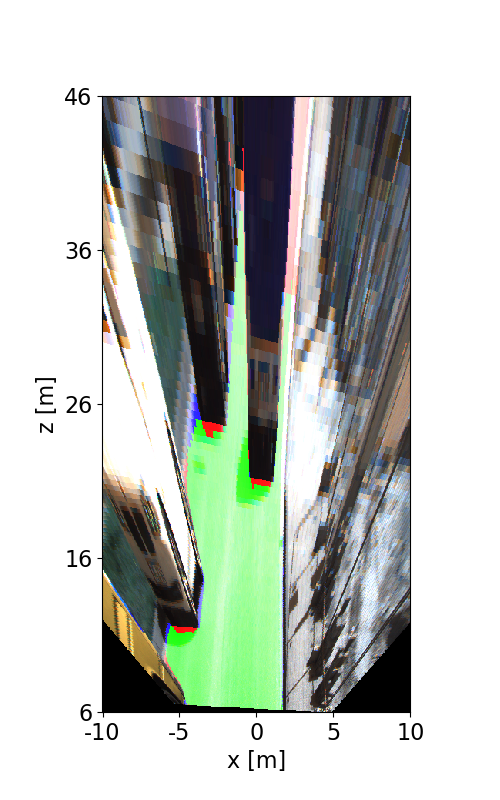
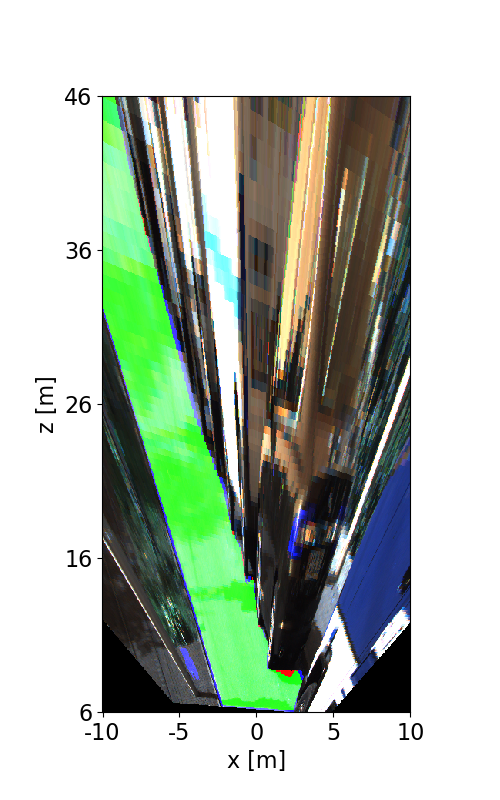
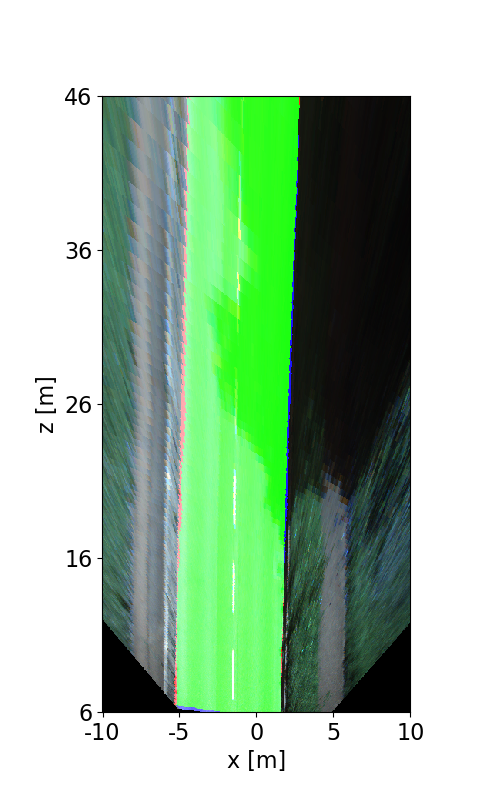
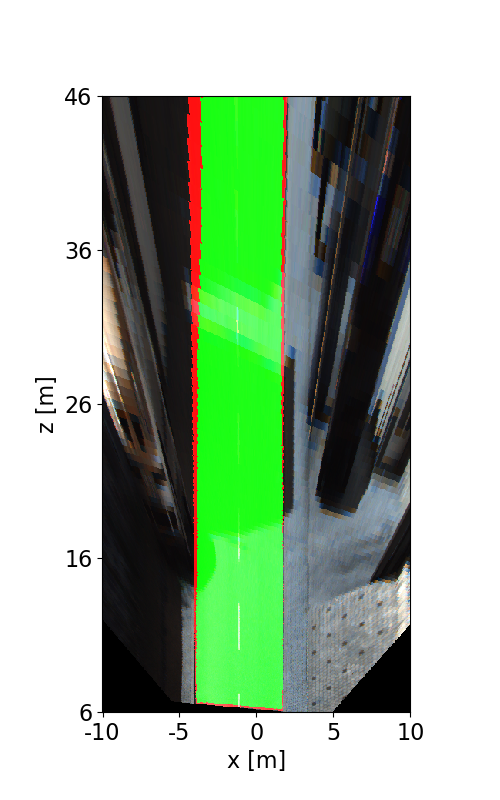
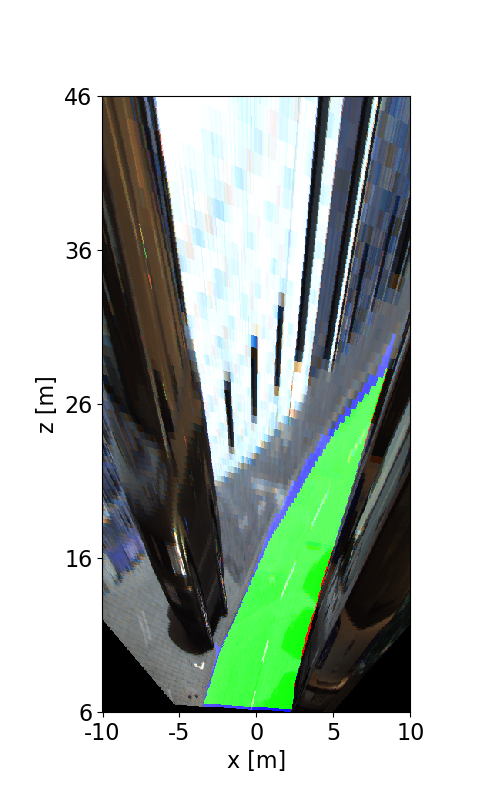
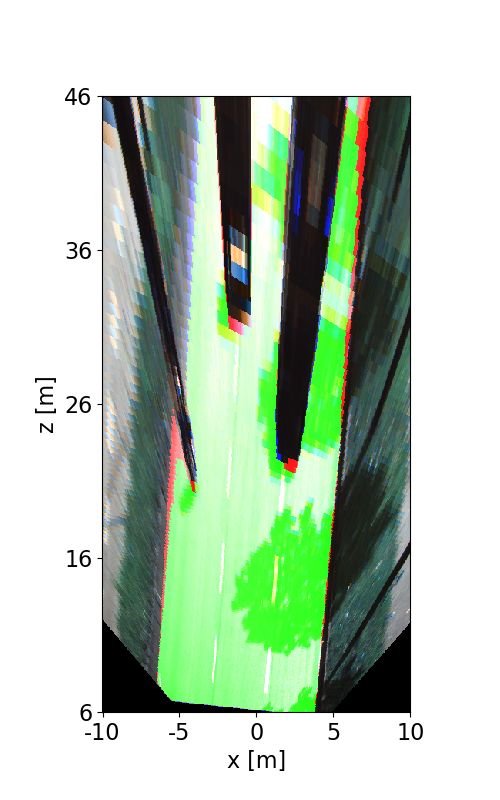
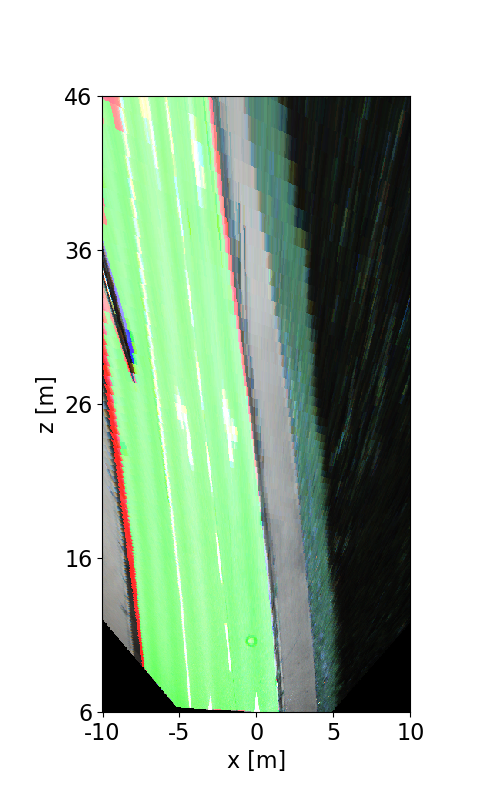
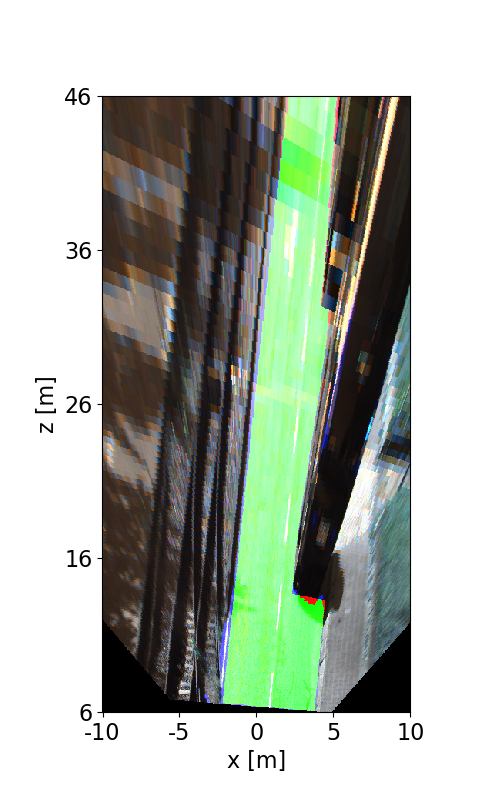
The following images illustrate the performance of the method qualitatively on a couple of test images. We first show results in the perspective image, followed by evaluation in bird's eye view. Here, red denotes false negatives, blue areas correspond to false positives and green represents true positives.


This figure as: png

This figure as: png

This figure as: png

This figure as: png

This figure as: png

This figure as: png

This figure as: png

This figure as: png

This figure as: png

This figure as: png

This figure as: png

This figure as: png

This figure as: png

This figure as: png

This figure as: png

This figure as: png

This figure as: png

This figure as: png


eXTReMe Tracker