Method

F-LOAM: Fast LiDAR Odometry And Mapping [FLOAM]
https://github.com/wh200720041/floam

Submitted on 9 Oct. 2022 06:11 by
Han Wang (Nanyang Technological University)

Running time:0.1 s
Environment:1 core @ 2.5 Ghz (C/C++)

Method Description:
Simultaneous Localization and Mapping (SLAM) has
wide robotic applications such as autonomous
driving and unmanned aerial vehicles. Both
computational efficiency and localization accuracy
are of great importance towards a good SLAM
system. Existing works on LiDAR based SLAM often
formulate the problem as two modules: scan-to-scan
match and scan-to-map refinement. Both modules are
solved by iterative calculation which are
computationally expensive. In this paper, we
propose a general solution that aims to provide a
computationally efficient and accurate framework
for LiDAR based SLAM.
Parameters:
\resolution=0.2
Latex Bibtex:
@INPROCEEDINGS{9636655,
author={Wang, Han and Wang, Chen and Chen, Chun-
Lin and Xie, Lihua},
booktitle={2021 IEEE/RSJ International
Conference on Intelligent Robots and Systems
(IROS)},
title={F-LOAM : Fast LiDAR Odometry and
Mapping},
year={2021},
volume={},
number={},
pages={4390-4396},
doi={10.1109/IROS51168.2021.9636655}}

Detailed Results

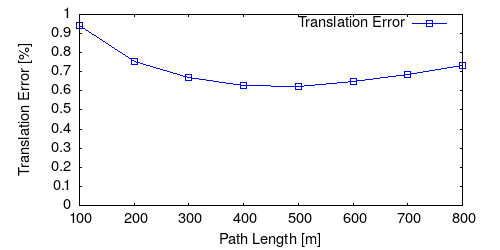
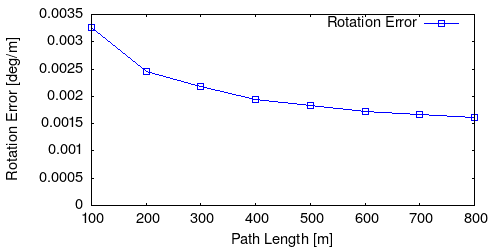
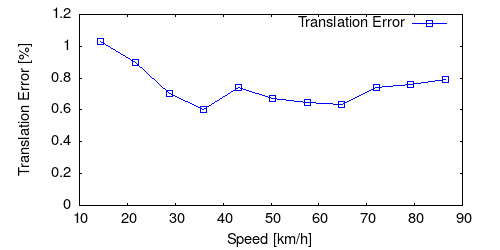
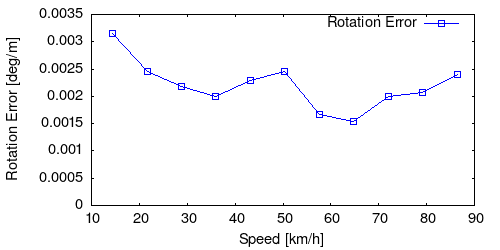
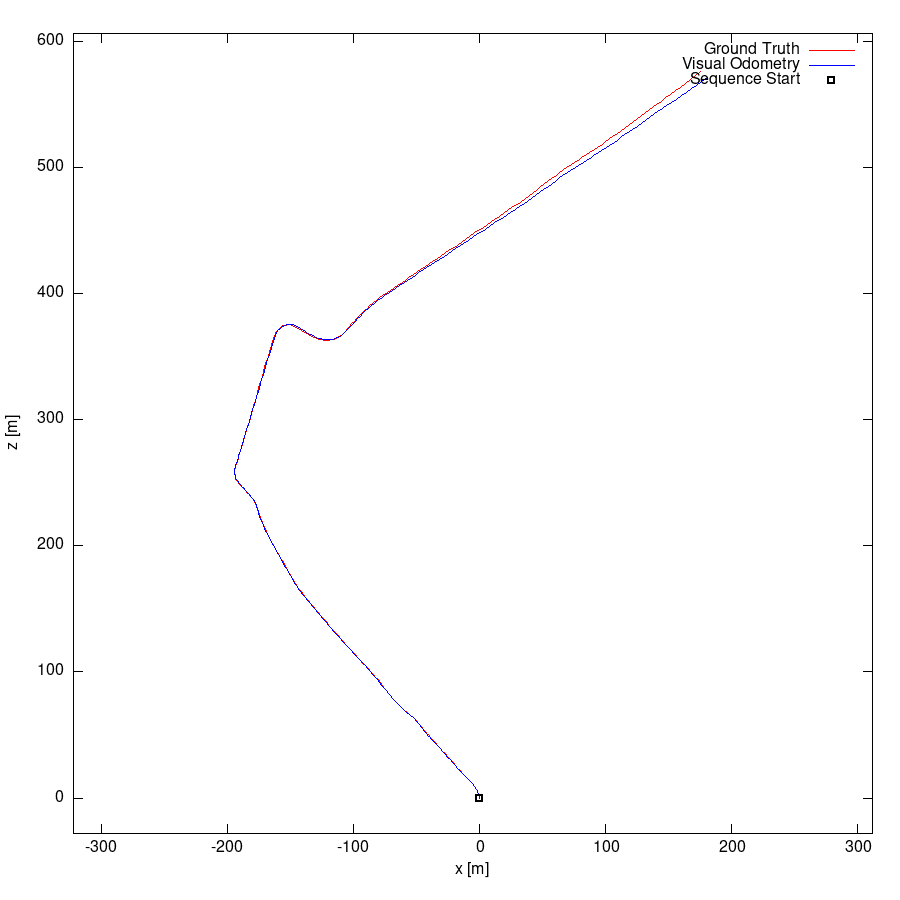
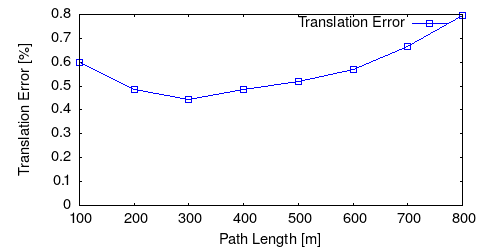
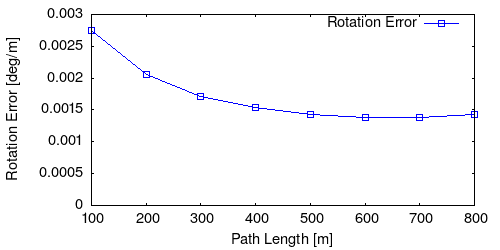
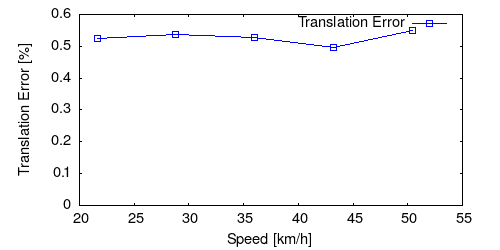
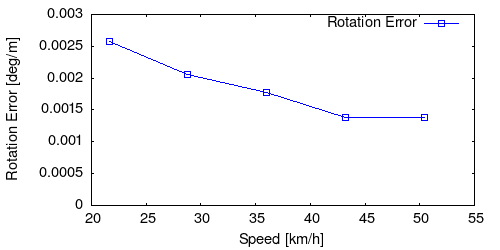
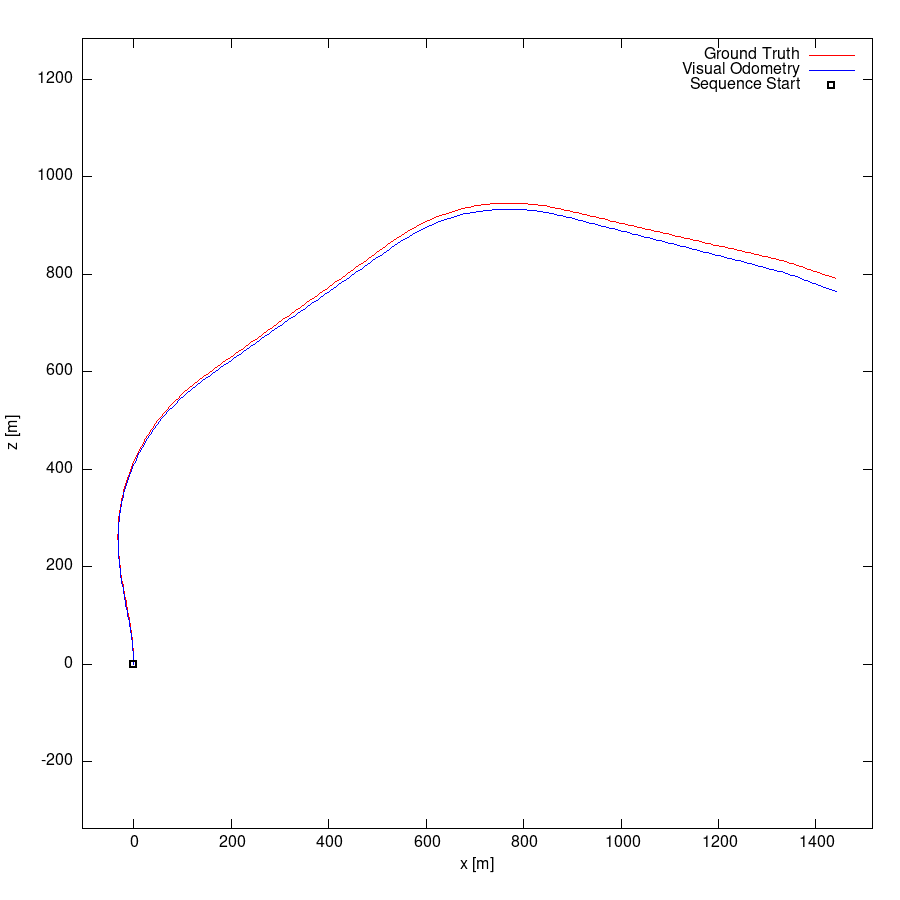
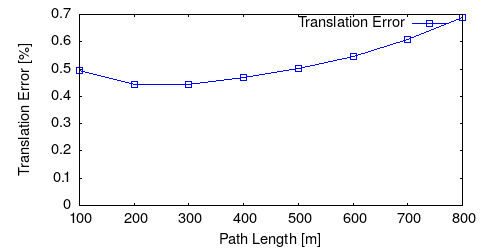
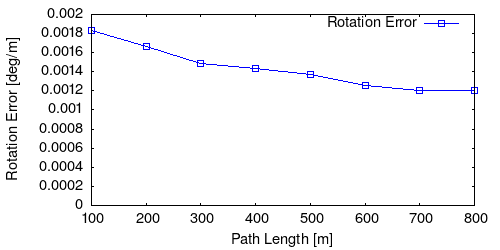
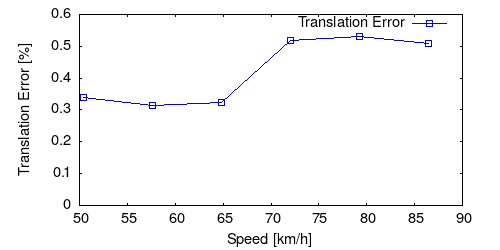
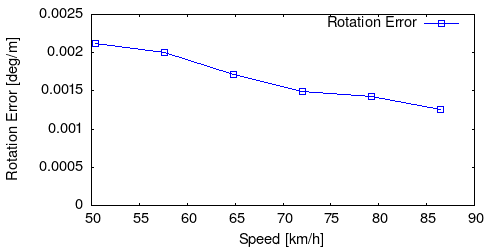
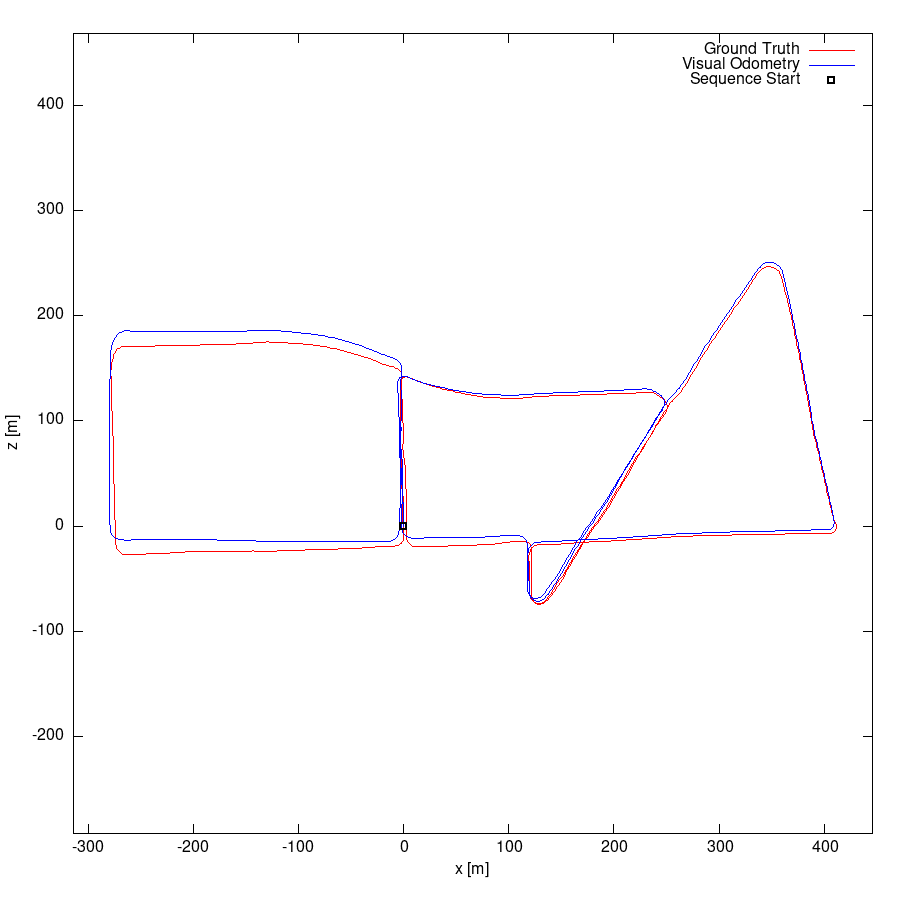
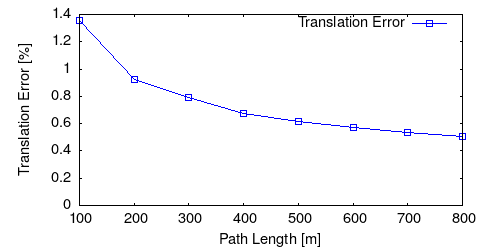
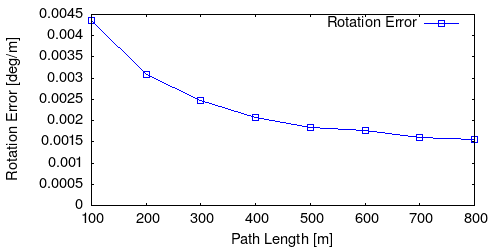
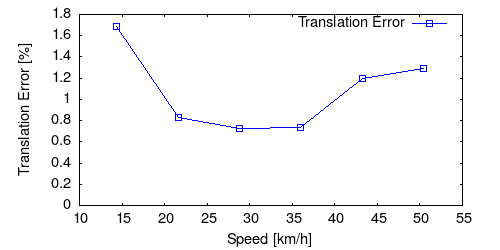
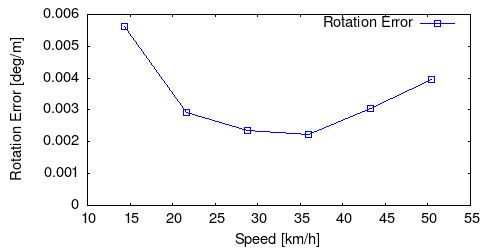
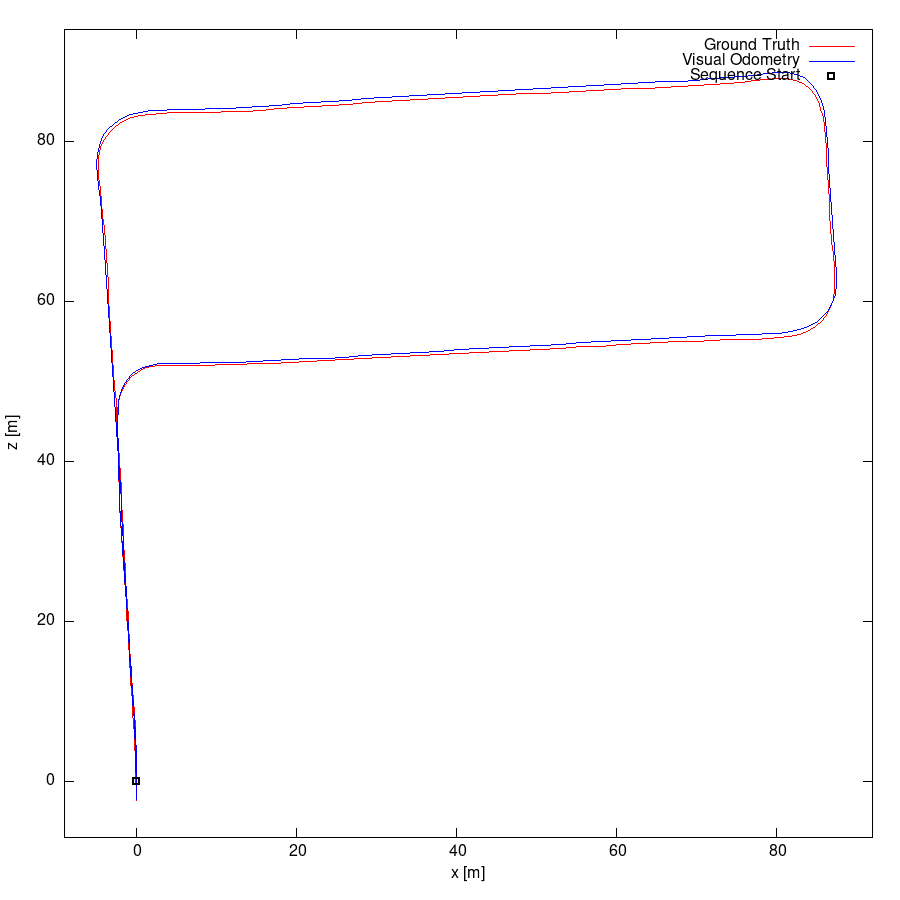
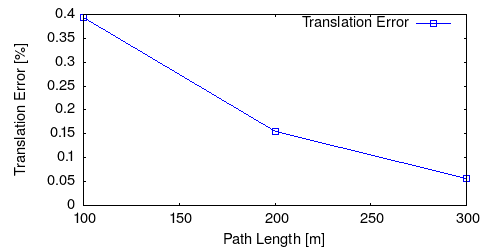
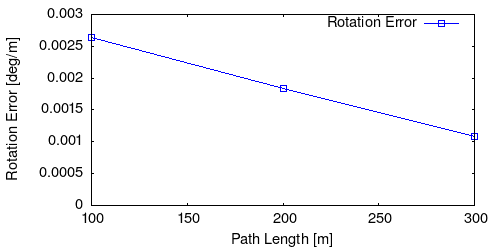
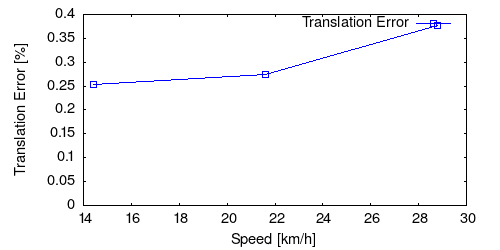
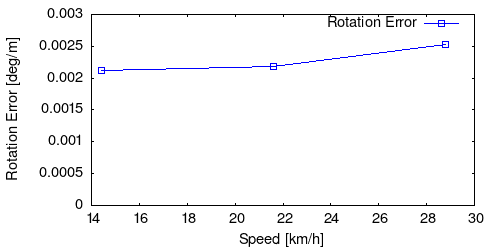
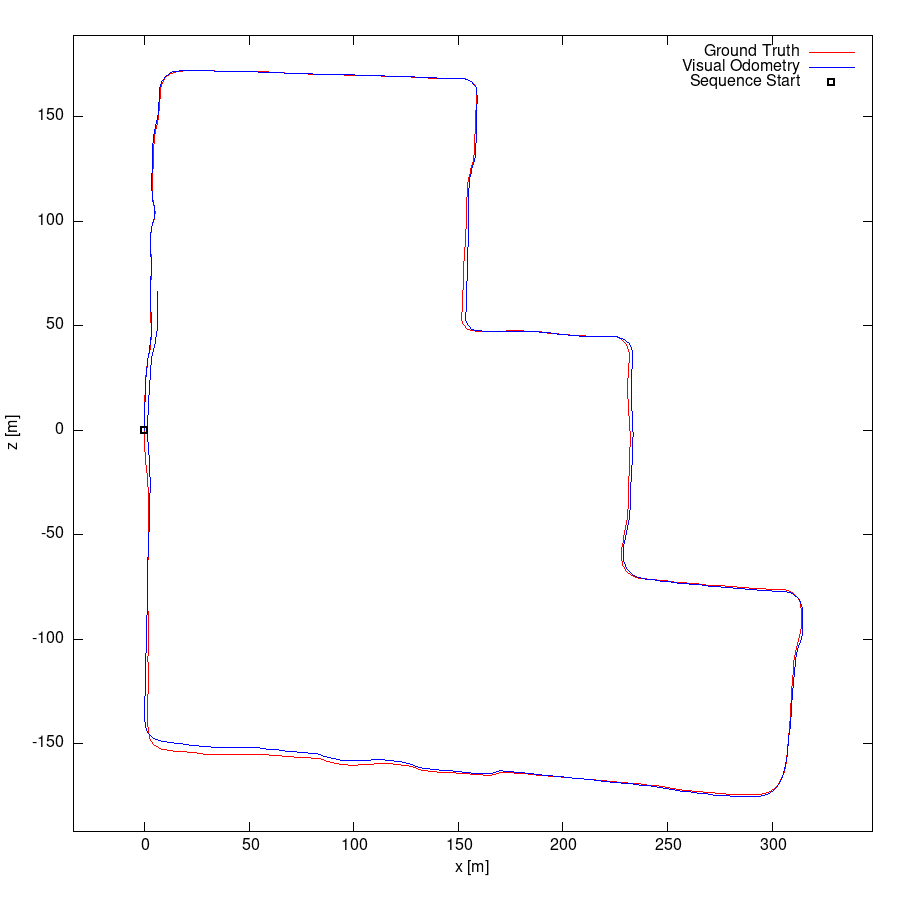
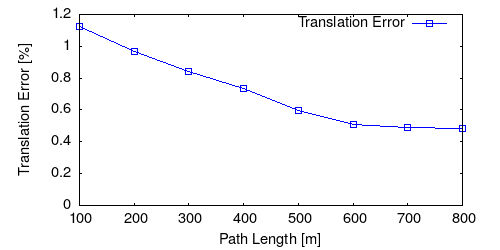
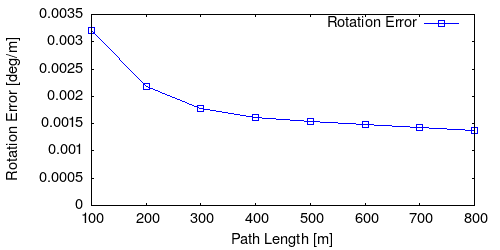
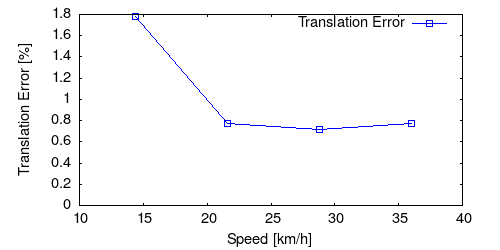
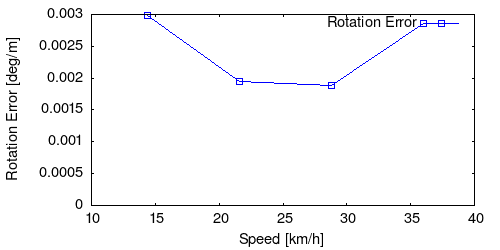
From all test sequences (sequences 11-21), our benchmark computes translational and rotational errors for all possible subsequences of length (5,10,50,100,150,...,400) meters. Our evaluation ranks methods according to the average of those values, where errors are measured in percent (for translation) and in degrees per meter (for rotation). Details for different trajectory lengths and driving speeds can be found in the plots underneath. Furthermore, the first 5 test trajectories and error plots are shown below.

Test Set Average


This figure as: png eps txt gnuplot


This figure as: png eps txt gnuplot


This figure as: png eps txt gnuplot


This figure as: png eps txt gnuplot


Sequence 11


This figure as: png eps txt gnuplot


This figure as: png eps txt gnuplot


This figure as: png eps txt gnuplot


This figure as: png eps txt gnuplot


This figure as: png eps txt gnuplot


Sequence 12


This figure as: png eps txt gnuplot


This figure as: png eps txt gnuplot


This figure as: png eps txt gnuplot


This figure as: png eps txt gnuplot


This figure as: png eps txt gnuplot


Sequence 13


This figure as: png eps txt gnuplot


This figure as: png eps txt gnuplot


This figure as: png eps txt gnuplot


This figure as: png eps txt gnuplot


This figure as: png eps txt gnuplot


Sequence 14


This figure as: png eps txt gnuplot


This figure as: png eps txt gnuplot


This figure as: png eps txt gnuplot


This figure as: png eps txt gnuplot


This figure as: png eps txt gnuplot


Sequence 15


This figure as: png eps txt gnuplot


This figure as: png eps txt gnuplot


This figure as: png eps txt gnuplot


This figure as: png eps txt gnuplot


This figure as: png eps txt gnuplot


eXTReMe Tracker