Method

Unleashing the Power of Chain-of-Prediction for Monocular 3D Object Detection [MonoCoP]
https://github.com/alanzhangcs/MonoCoP

Submitted on 17 Nov. 2025 06:59 by
Zhihao Zhang (Michigan State University)

Running time:0.01 s
Environment:1 core @ 2.5 Ghz (C/C++)

Method Description:
Monocular 3D detection (Mono3D) aims to infer 3D
bounding boxes from a single RGB image. Without
auxiliary sensors such as LiDAR, this task is
inherently ill-posed since the 3D-to-2D projection
introduces depth ambiguity. Previous works often
predict 3D attributes (e.g., depth, size, and
orientation) in parallel, overlooking that these
attributes are inherently correlated through the
3D-to-2D projection. However, simply enforcing such
correlations through sequential prediction can
propagate errors across attributes, especially when
objects are occluded or truncated, where inaccurate
size or orientation predictions can further amplify
depth errors. Therefore, neither parallel nor
sequential prediction is optimal. In this paper, we
propose MonoCoP, an adaptive framework that learns
when and how to leverage inter-attribute
correlations with two complementary designs. A
Chain-of-Prediction (CoP) explores inter-attribute
correlations through feature-level learning,
propagation, and aggregat
Parameters:
none
Latex Bibtex:
@inproceedings{zhang2025unleashing,
title={Unleashing the Power of Chain-of-
Prediction for Monocular 3D Object Detection},
author={Zhang, Zhihao and Kumar, Abhinav and
Ganesan, Girish Chandar and Liu, Xiaoming},
booktitle={Proceedings of the IEEE/CVF Conference
on Computer Vision and Pattern Recognition},
year={2026}
}

Detailed Results

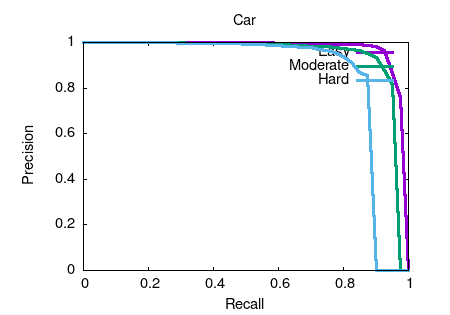
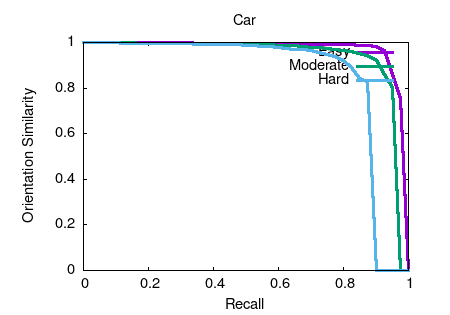
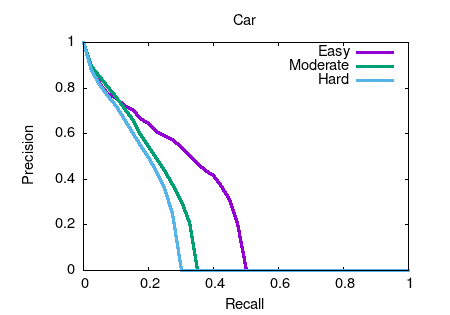
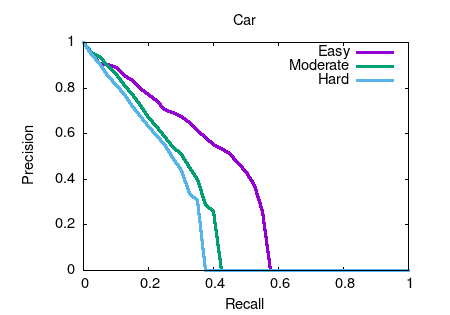
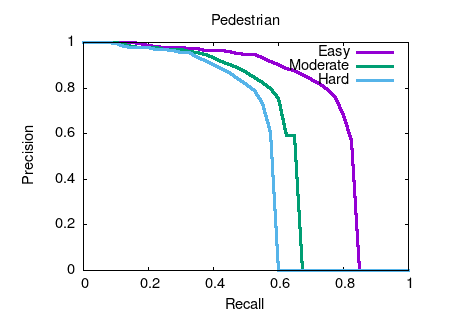
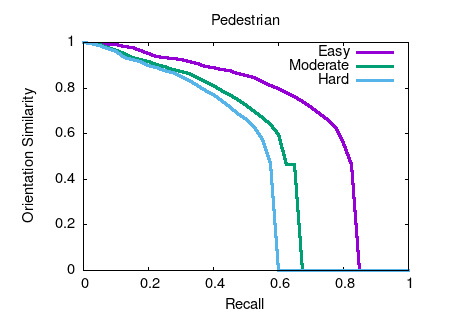
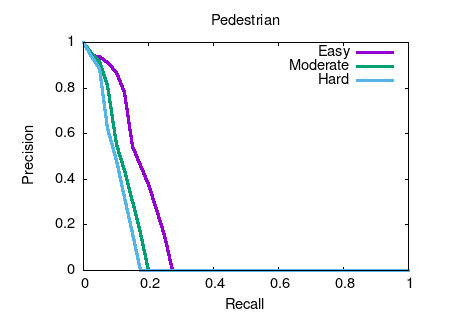
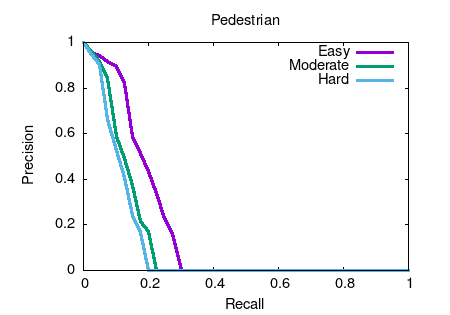
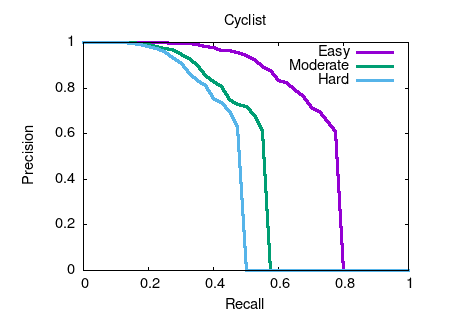
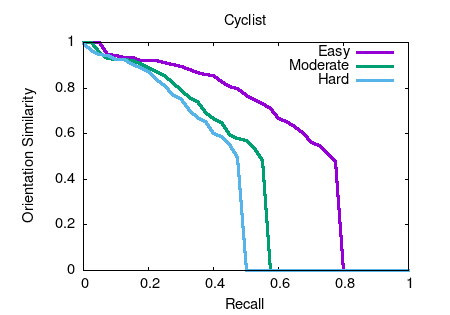
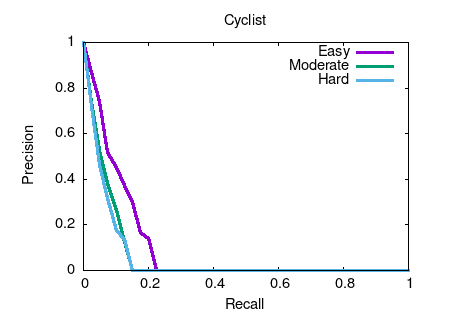
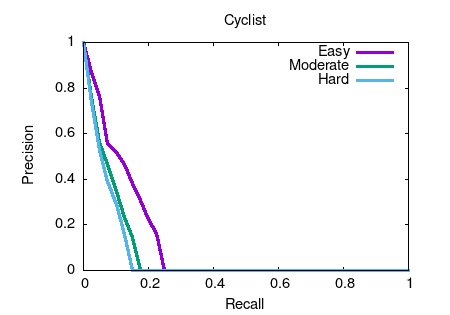
Object detection and orientation estimation results. Results for object detection are given in terms of average precision (AP) and results for joint object detection and orientation estimation are provided in terms of average orientation similarity (AOS).


Benchmark Easy Moderate Hard
Car (Detection) 96.23 % 93.29 % 85.74 %
Car (Orientation) 96.00 % 92.84 % 85.07 %
Car (3D Detection) 27.54 % 19.11 % 16.33 %
Car (Bird's Eye View) 36.77 % 25.75 % 22.62 %
Pedestrian (Detection) 75.95 % 58.96 % 52.60 %
Pedestrian (Orientation) 69.91 % 52.82 % 46.94 %
Pedestrian (3D Detection) 15.61 % 10.33 % 8.53 %
Pedestrian (Bird's Eye View) 16.99 % 11.40 % 9.63 %
Cyclist (Detection) 70.87 % 49.15 % 42.66 %
Cyclist (Orientation) 61.89 % 42.68 % 37.02 %
Cyclist (3D Detection) 8.89 % 5.08 % 4.53 %
Cyclist (Bird's Eye View) 10.61 % 6.27 % 5.25 %
This table as LaTeX


2D object detection results.
This figure as: png eps txt gnuplot


Orientation estimation results.
This figure as: png eps txt gnuplot


3D object detection results.
This figure as: png eps txt gnuplot


Bird's eye view results.
This figure as: png eps txt gnuplot


2D object detection results.
This figure as: png eps txt gnuplot


Orientation estimation results.
This figure as: png eps txt gnuplot


3D object detection results.
This figure as: png eps txt gnuplot


Bird's eye view results.
This figure as: png eps txt gnuplot


2D object detection results.
This figure as: png eps txt gnuplot


Orientation estimation results.
This figure as: png eps txt gnuplot


3D object detection results.
This figure as: png eps txt gnuplot


Bird's eye view results.
This figure as: png eps txt gnuplot


eXTReMe Tracker