Method

Bayesian-based Multi-cue Fusion Method [st] [BMCF]


Submitted on 7 Jan. 2020 05:38 by
Li Wang (National University of Defense Technology)

Running time:2.5 s
Environment:1 core @ 2.5 Ghz (C/C++)

Method Description:
Firstly boundary areas are determined in accordance with
the normal vector information. Based on the cues of normal
vector, height and color in the boundary area, three Bayes
models are established respectively. Then the Naive Bayes
framework could provide the confidence level of each point
in the boundary area, which fuses three kinds of cues. In
each boundary area, the point with the highest confidence
level would be output. Finally, the support vector regression
(SVR) method fits curb curves according to the correct edge
points.
Parameters:
gamma=0.0002
Latex Bibtex:
@inproceedings{wang2016multi,
title={Multi-cue road boundary detection using stereo
vision},
author={Wang, Li and Wu, Tao and Xiao, Zhipeng and Xiao,
Liang and Zhao, Dawei and Han, Jiarong},
booktitle={2016 IEEE International Conference on Vehicular
Electronics and Safety (ICVES)},
pages={1--6},
year={2016},
organization={IEEE}
}

Evaluation in Bird's Eye View


Benchmark MaxF AP PRE REC FPR FNR
UM_ROAD 89.42 % 83.13 % 88.31 % 90.55 % 5.46 % 9.45 %
UMM_ROAD 92.21 % 87.99 % 91.55 % 92.89 % 9.43 % 7.11 %
UU_ROAD 85.46 % 74.07 % 85.06 % 85.86 % 4.91 % 14.14 %
URBAN_ROAD 89.75 % 84.15 % 89.02 % 90.49 % 6.15 % 9.51 %
This table as LaTeX

Behavior Evaluation


Benchmark PRE-20 F1-20 HR-20 PRE-30 F1-30 HR-30 PRE-40 F1-40 HR-40
This table as LaTeX

Road/Lane Detection

The following plots show precision/recall curves for the bird's eye view evaluation.


Distance-dependent Behavior Evaluation

The following plots show the F1 score/Precision/Hitrate with respect to the longitudinal distance which has been used for evaluation.


Visualization of Results

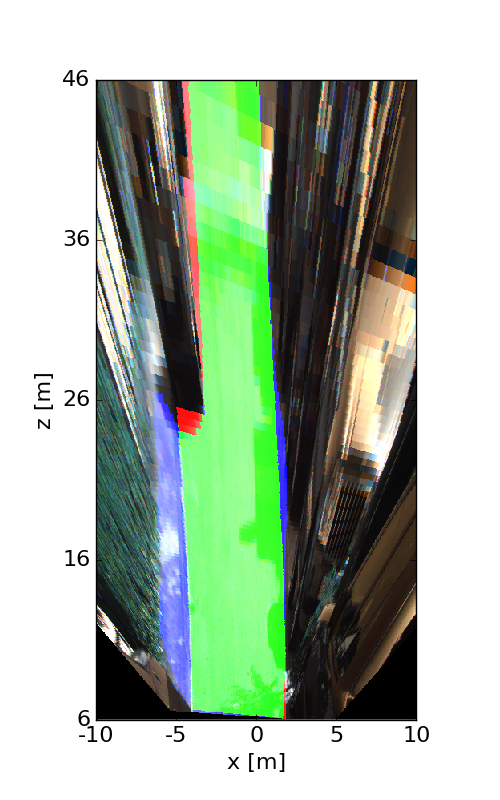
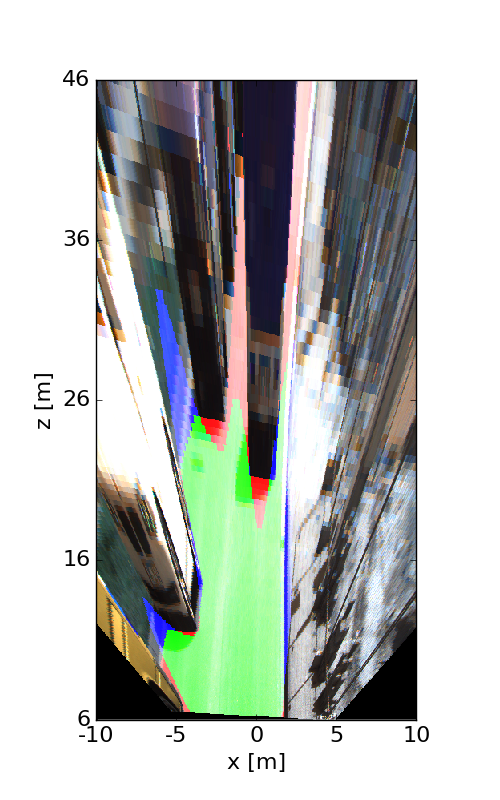
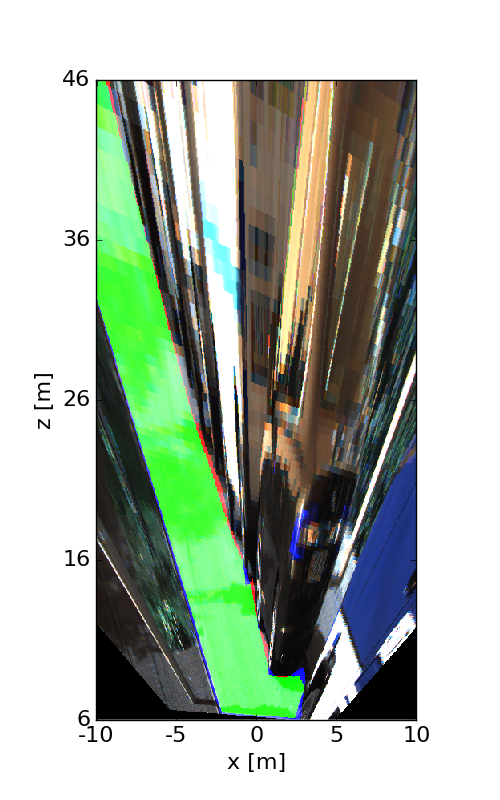
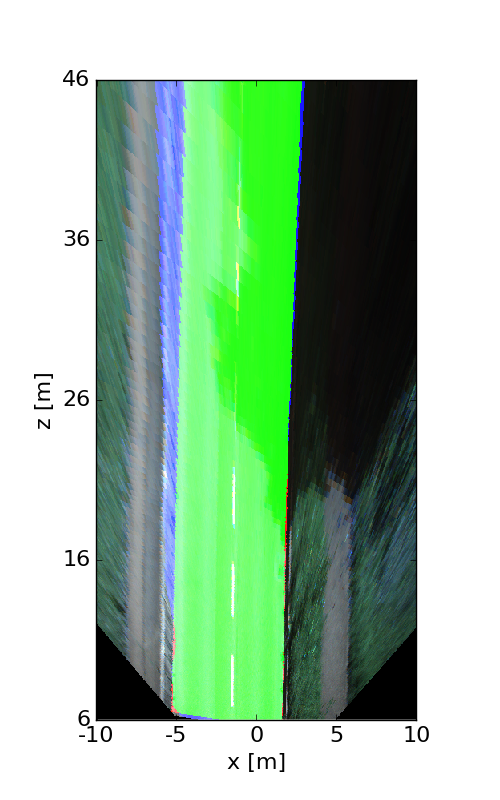
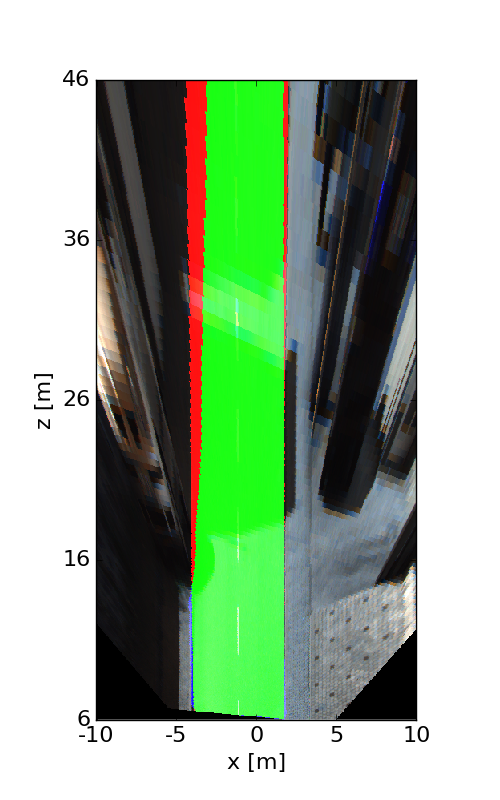
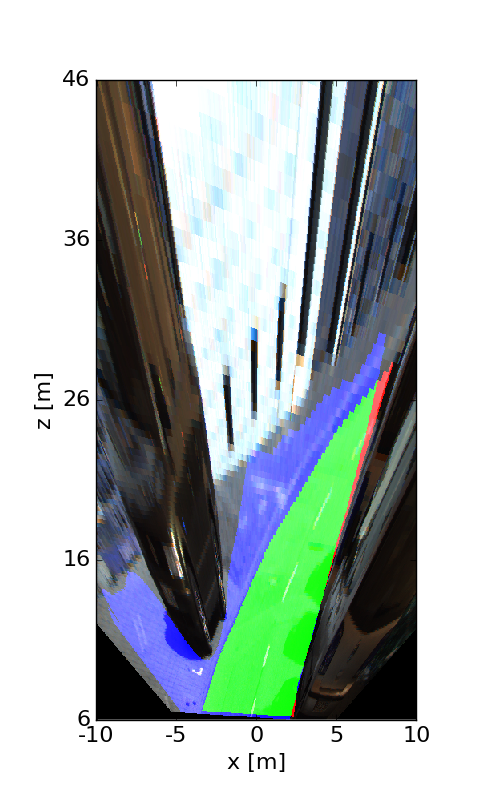
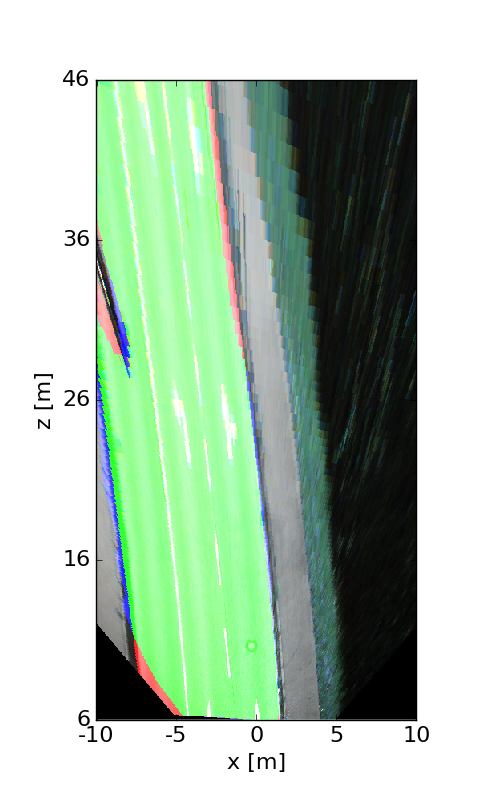
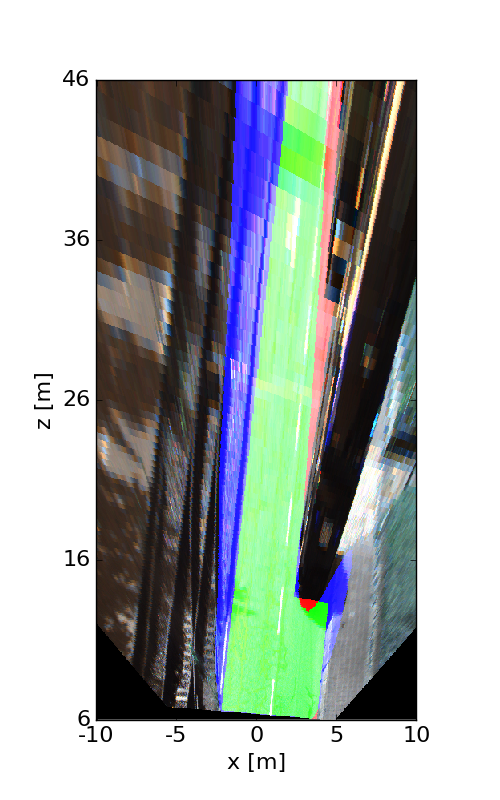
The following images illustrate the performance of the method qualitatively on a couple of test images. We first show results in the perspective image, followed by evaluation in bird's eye view. Here, red denotes false negatives, blue areas correspond to false positives and green represents true positives.


This figure as: png

This figure as: png

This figure as: png

This figure as: png

This figure as: png

This figure as: png

This figure as: png

This figure as: png

This figure as: png

This figure as: png

This figure as: png

This figure as: png

This figure as: png

This figure as: png

This figure as: png

This figure as: png

This figure as: png

This figure as: png


eXTReMe Tracker