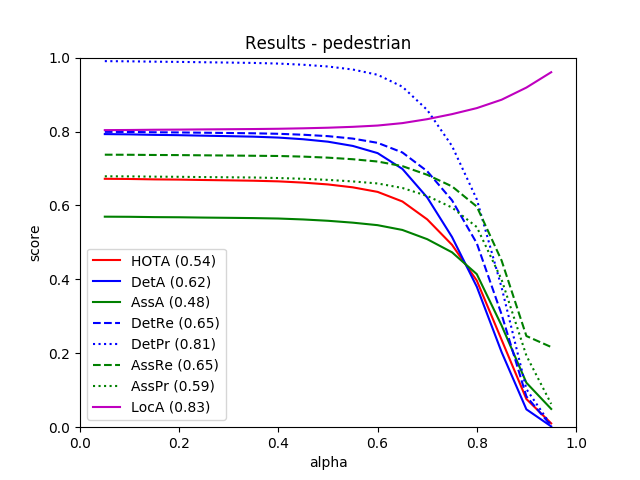
From all 29 test sequences, our benchmark computes the HOTA tracking metrics (HOTA, DetA, AssA, DetRe, DetPr, AssRe, AssPr, LocA) [1] as well as the CLEARMOT, MT/PT/ML, identity switches, and fragmentation [2,3] metrics.
The tables below show all of these metrics.
| Benchmark |
HOTA |
DetA |
AssA |
DetRe |
DetPr |
AssRe |
AssPr |
LocA |
| PEDESTRIAN |
54.44 % |
62.29 % |
48.08 % |
65.49 % |
81.17 % |
64.97 % |
58.66 % |
83.28 % |
| Benchmark |
TP |
FP |
FN |
| PEDESTRIAN |
16356 |
4341 |
344 |
| Benchmark |
MOTSA |
MOTSP |
MODSA |
IDSW |
sMOTSA |
| PEDESTRIAN |
76.51 % |
80.96 % |
77.36 % |
176 |
61.47 % |
| Benchmark |
MT rate |
PT rate |
ML rate |
FRAG |
| PEDESTRIAN |
48.89 % |
41.85 % |
9.26 % |
716 |
| Benchmark |
# Dets |
# Tracks |
| PEDESTRIAN |
16700 |
212 |
This table as LaTeX
|
[1] J. Luiten, A. Os̆ep, P. Dendorfer, P. Torr, A. Geiger, L. Leal-Taixé, B. Leibe:
HOTA: A Higher Order Metric for Evaluating Multi-object Tracking. IJCV 2020.
[2] K. Bernardin, R. Stiefelhagen:
Evaluating Multiple Object Tracking Performance: The CLEAR MOT Metrics. JIVP 2008.
[3] Y. Li, C. Huang, R. Nevatia:
Learning to associate: HybridBoosted multi-target tracker for crowded scene. CVPR 2009.