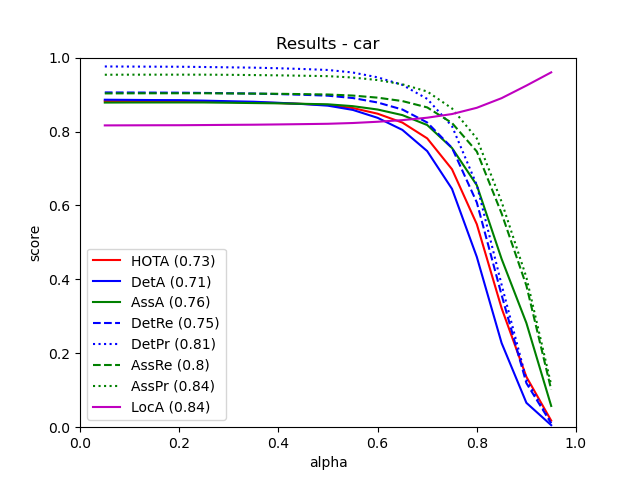
From all 29 test sequences, our benchmark computes the HOTA tracking metrics (HOTA, DetA, AssA, DetRe, DetPr, AssRe, AssPr, LocA) [1] as well as the CLEARMOT, MT/PT/ML, identity switches, and fragmentation [2,3] metrics.
The tables below show all of these metrics.
| Benchmark |
HOTA |
DetA |
AssA |
DetRe |
DetPr |
AssRe |
AssPr |
LocA |
| CAR |
72.80 % |
70.85 % |
75.62 % |
75.44 % |
81.30 % |
79.97 % |
84.33 % |
84.13 % |
| Benchmark |
TP |
FP |
FN |
| CAR |
30873 |
3519 |
1044 |
| Benchmark |
MOTA |
MOTP |
MODA |
IDSW |
sMOTA |
| CAR |
86.13 % |
82.06 % |
86.73 % |
208 |
70.02 % |
| Benchmark |
MT rate |
PT rate |
ML rate |
FRAG |
| CAR |
72.77 % |
22.77 % |
4.46 % |
321 |
| Benchmark |
# Dets |
# Tracks |
| CAR |
31917 |
720 |
This table as LaTeX
|
[1] J. Luiten, A. Os̆ep, P. Dendorfer, P. Torr, A. Geiger, L. Leal-Taixé, B. Leibe:
HOTA: A Higher Order Metric for Evaluating Multi-object Tracking. IJCV 2020.
[2] K. Bernardin, R. Stiefelhagen:
Evaluating Multiple Object Tracking Performance: The CLEAR MOT Metrics. JIVP 2008.
[3] Y. Li, C. Huang, R. Nevatia:
Learning to associate: HybridBoosted multi-target tracker for crowded scene. CVPR 2009.