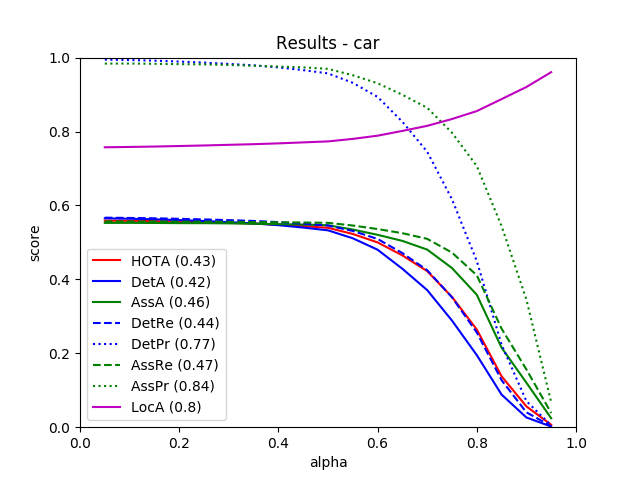
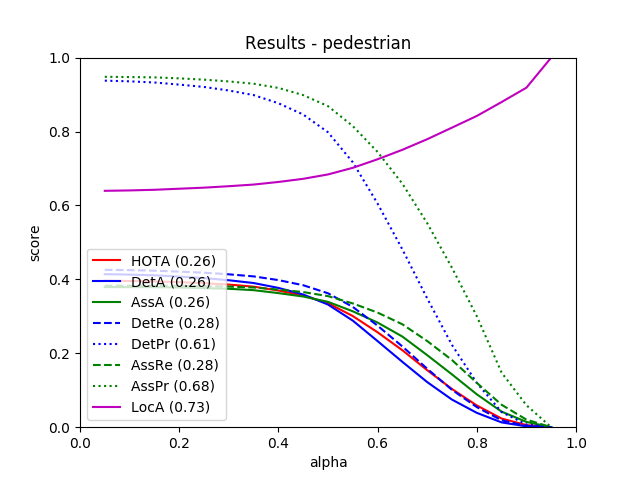
From all 29 test sequences, our benchmark computes the HOTA tracking metrics (HOTA, DetA, AssA, DetRe, DetPr, AssRe, AssPr, LocA) [1] as well as the CLEARMOT, MT/PT/ML, identity switches, and fragmentation [2,3] metrics.
The tables below show all of these metrics.
| Benchmark |
HOTA |
DetA |
AssA |
DetRe |
DetPr |
AssRe |
AssPr |
LocA |
| CAR |
43.41 % |
41.72 % |
45.77 % |
43.72 % |
76.72 % |
47.45 % |
83.68 % |
80.44 % |
| PEDESTRIAN |
25.83 % |
25.54 % |
26.41 % |
27.54 % |
60.66 % |
27.91 % |
68.34 % |
73.43 % |
| Benchmark |
TP |
FP |
FN |
| CAR |
18794 |
15598 |
807 |
| PEDESTRIAN |
8492 |
14658 |
2020 |
| Benchmark |
MOTA |
MOTP |
MODA |
IDSW |
sMOTA |
| CAR |
51.34 % |
77.26 % |
52.30 % |
330 |
38.91 % |
| PEDESTRIAN |
26.59 % |
68.27 % |
27.96 % |
317 |
14.95 % |
| Benchmark |
MT rate |
PT rate |
ML rate |
FRAG |
| CAR |
20.31 % |
47.85 % |
31.85 % |
275 |
| PEDESTRIAN |
8.93 % |
39.52 % |
51.55 % |
526 |
| Benchmark |
# Dets |
# Tracks |
| CAR |
19601 |
829 |
| PEDESTRIAN |
10512 |
480 |
This table as LaTeX
|
[1] J. Luiten, A. Os̆ep, P. Dendorfer, P. Torr, A. Geiger, L. Leal-Taixé, B. Leibe:
HOTA: A Higher Order Metric for Evaluating Multi-object Tracking. IJCV 2020.
[2] K. Bernardin, R. Stiefelhagen:
Evaluating Multiple Object Tracking Performance: The CLEAR MOT Metrics. JIVP 2008.
[3] Y. Li, C. Huang, R. Nevatia:
Learning to associate: HybridBoosted multi-target tracker for crowded scene. CVPR 2009.