Method

Exploiting Low-Level Representations for Ultra-Fast Road Segmentation [LFD-RoadSeg]
https://github.com/zhouhuan-hust/LFD-RoadSeg

Submitted on 16 Apr. 2024 10:50 by
li yucong (hust)

Running time:.004 s
Environment:GPU @ 1.5 Ghz (Python)

Method Description:
We propose a Low-level Feature Dominated Road Segmentation
network (LFD-RoadSeg). Specifically, LFD-RoadSeg employs a
bilateral structure. On KITTI-Road, LFD-RoadSeg achieves a
maximum F1-measure (MaxF) of 95.21% and an average precision of
93.71%, while reaching 238 FPS on a single TITAN Xp and 54 FPS on
a Jetson TX2, all with a compact model size of just 936k parameters.
Parameters:
λ_b = 0.7
Latex Bibtex:
@ARTICLE{10440170,

author={Zhou, Huan and Xue, Feng and Li, Yucong and Gong, Shi
and Li, Yiqun and Zhou, Yu},

journal={IEEE Transactions on Intelligent Transportation Systems},

title={Exploiting Low-Level Representations for Ultra-Fast Road
Segmentation},

year={2024},

volume={},

number={},

pages={1-11},

keywords={Roads;Feature extraction;Semantics;Semantic
segmentation;Graphics processing units;Object
recognition;Electronic mail;Road segmentation;real-time;low-level
representation;selective fusion},

doi={10.1109/TITS.2024.3359242}}


Evaluation in Bird's Eye View


Benchmark MaxF AP PRE REC FPR FNR
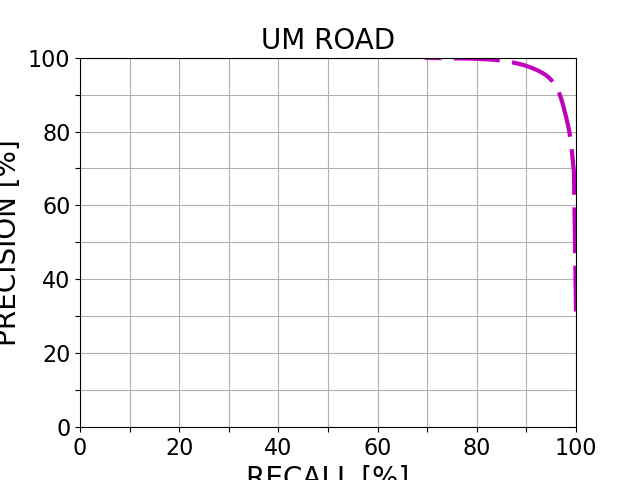
UM_ROAD 94.58 % 93.42 % 95.20 % 93.98 % 2.16 % 6.02 %
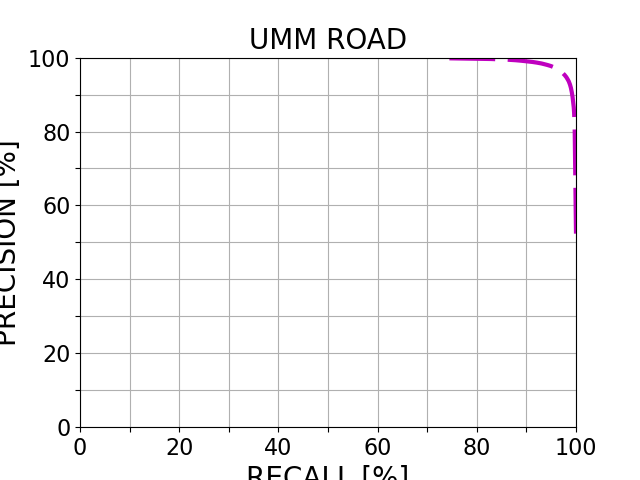
UMM_ROAD 96.59 % 95.40 % 96.29 % 96.90 % 4.11 % 3.10 %
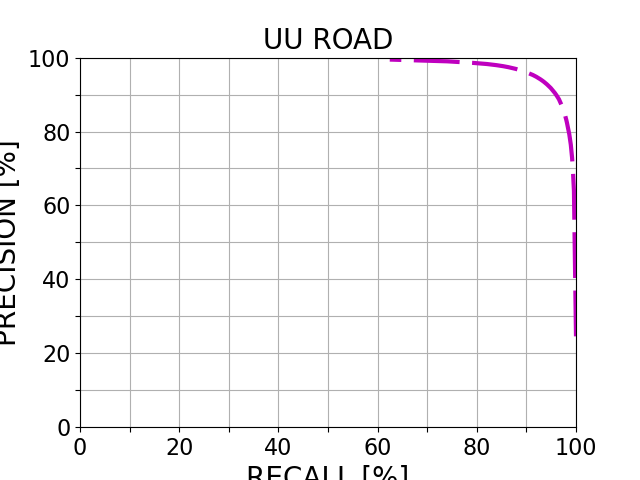
UU_ROAD 93.49 % 92.19 % 93.46 % 93.52 % 2.13 % 6.48 %
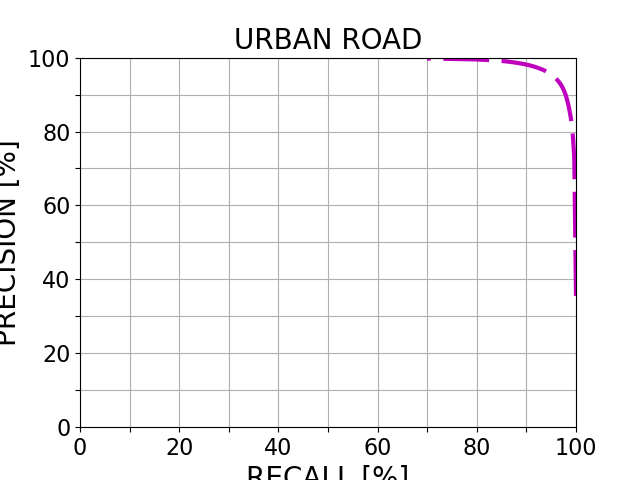
URBAN_ROAD 95.21 % 93.71 % 95.35 % 95.08 % 2.56 % 4.92 %
This table as LaTeX

Behavior Evaluation


Benchmark PRE-20 F1-20 HR-20 PRE-30 F1-30 HR-30 PRE-40 F1-40 HR-40
This table as LaTeX

Road/Lane Detection

The following plots show precision/recall curves for the bird's eye view evaluation.


This figure as: png eps pdf

This figure as: png eps pdf

This figure as: png eps pdf

This figure as: png eps pdf

Distance-dependent Behavior Evaluation

The following plots show the F1 score/Precision/Hitrate with respect to the longitudinal distance which has been used for evaluation.


Visualization of Results

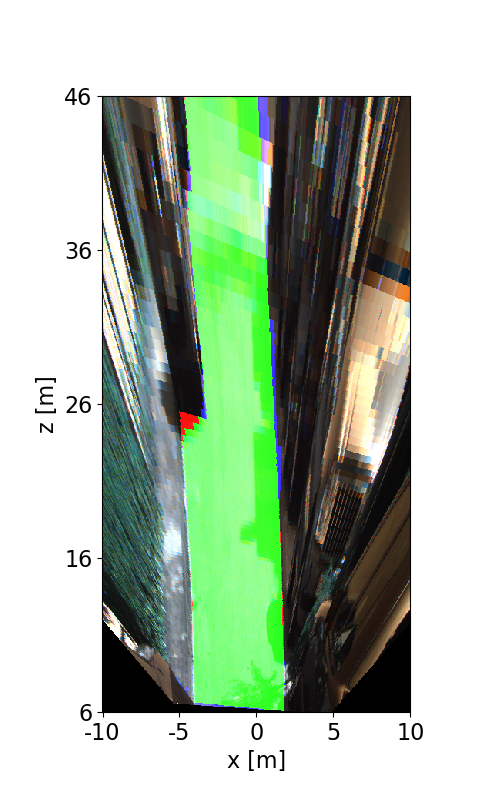
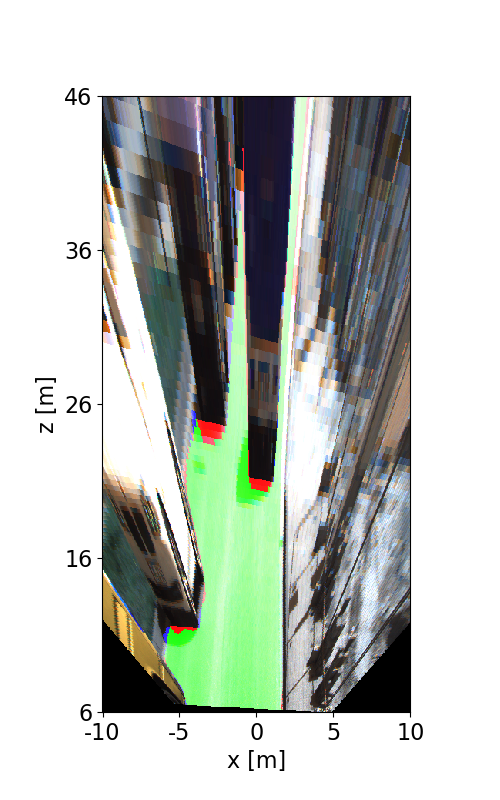
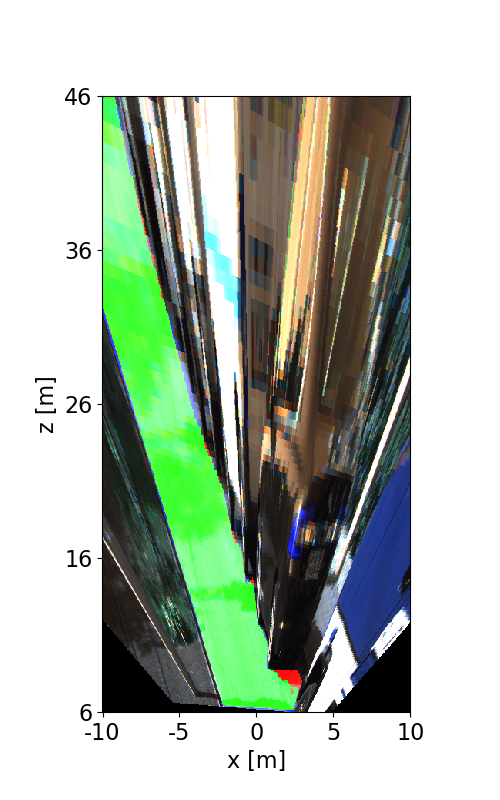
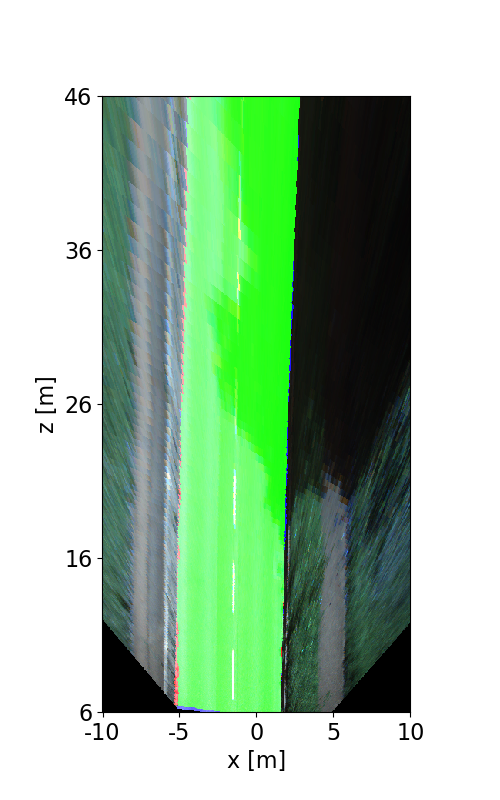
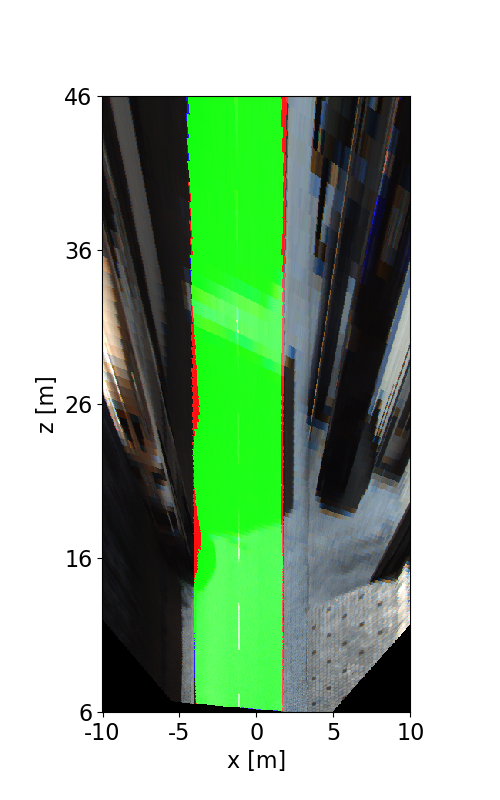
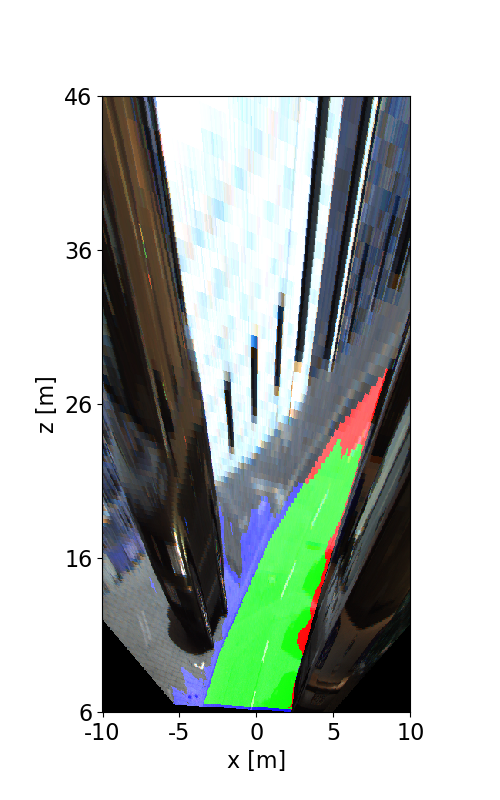
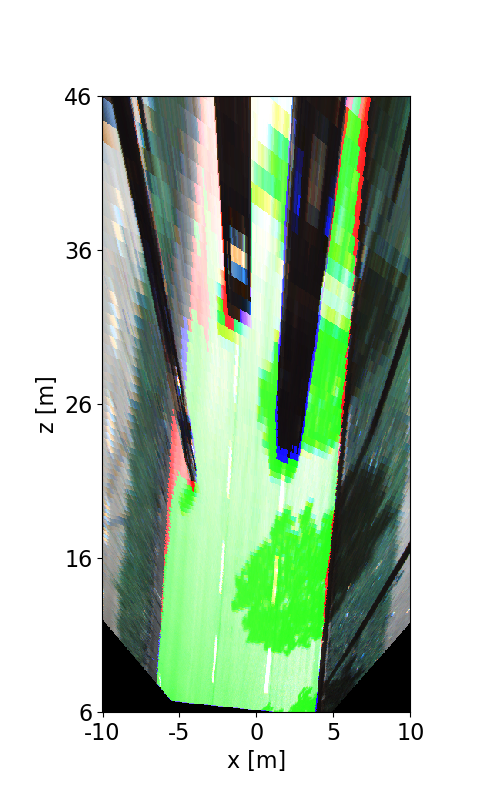
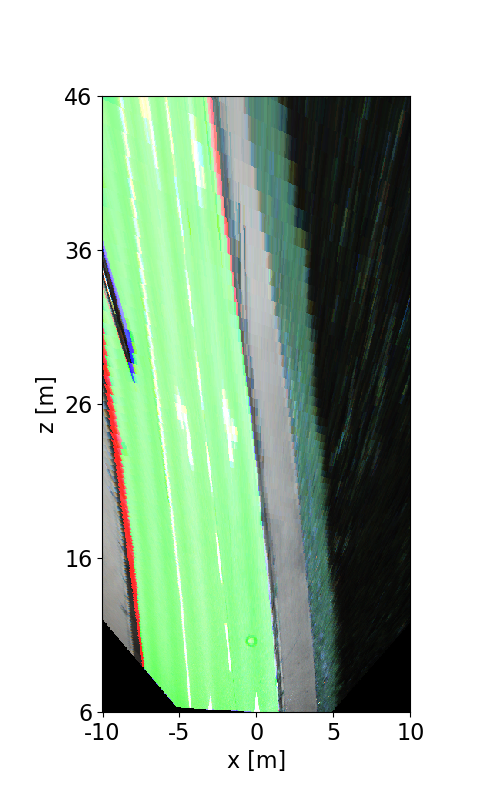
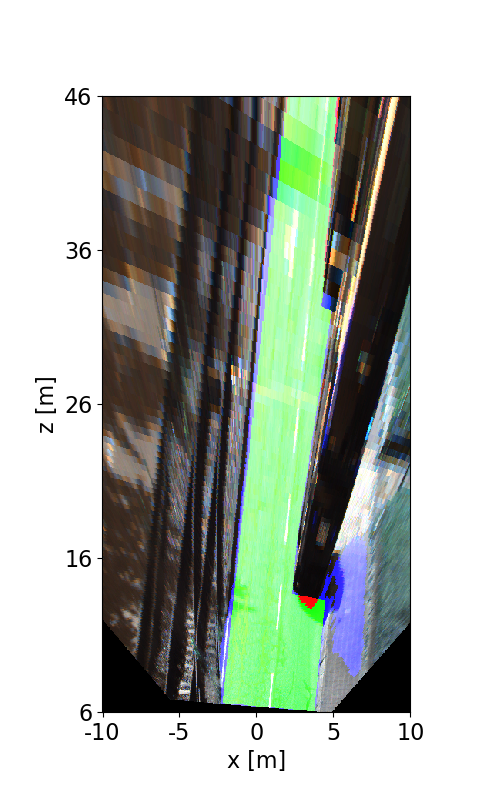
The following images illustrate the performance of the method qualitatively on a couple of test images. We first show results in the perspective image, followed by evaluation in bird's eye view. Here, red denotes false negatives, blue areas correspond to false positives and green represents true positives.


This figure as: png

This figure as: png

This figure as: png

This figure as: png

This figure as: png

This figure as: png

This figure as: png

This figure as: png

This figure as: png

This figure as: png

This figure as: png

This figure as: png

This figure as: png

This figure as: png

This figure as: png

This figure as: png

This figure as: png

This figure as: png


eXTReMe Tracker