Method

DeepCLR: Correspondence-Less Architecture for Deep End-to-End Point Cloud Registration [la] [DeepCLR]
https://github.com/mhorn11/deepclr

Submitted on 25 May. 2021 14:56 by
Markus Horn (Ulm University, Institute of Measurement, Control and Microtechnology)

Running time:0.05 s
Environment:GPU @ 1.0 Ghz (Python)

Method Description:
DeepCLR applies flow embedding to generate features that describe the motion of each template point. These features are then used to predict the alignment in an end-to-end fashion without extracting explicit point correspondences between both input clouds.
Parameters:
n_fps: 1024
SA radii: 0.5, 10
n_sa: 512, 1024
FE radius: 10.0
n_fe: 15
Loss beta: 200
MLP_sa: [16, 16, 32]
MLP_fe: [128, 128, 256]
MLP_pn: [256, 512, 512, 1024]
MLP_fc: [512, 256, 8]
Latex Bibtex:
@inproceedings{horn2020deepclr,
author={Horn, Markus and Engel, Nico and Belagiannis, Vasileios and Buchholz, Michael and Dietmayer, Klaus},
booktitle={2020 IEEE 23rd International Conference on Intelligent Transportation Systems (ITSC)},
title={DeepCLR: Correspondence-Less Architecture for Deep End-to-End Point Cloud Registration},
year={2020},
pages={1-7},
doi={10.1109/ITSC45102.2020.9294279}
}

Detailed Results

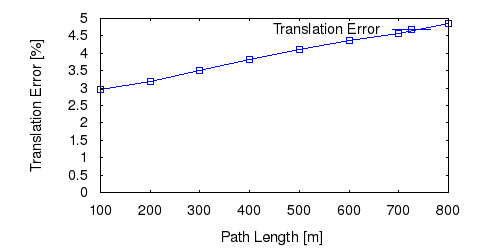
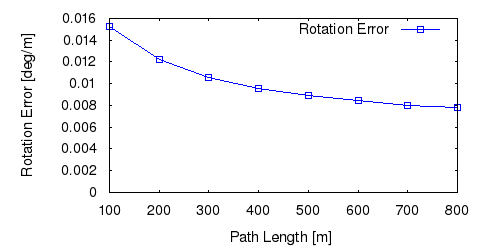
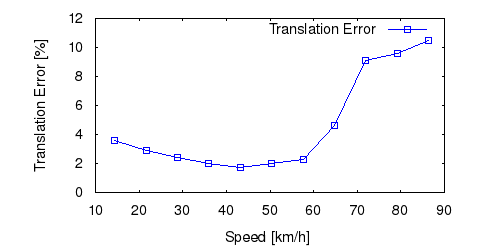
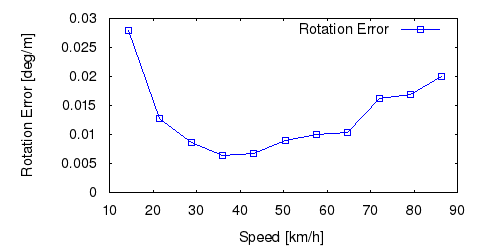
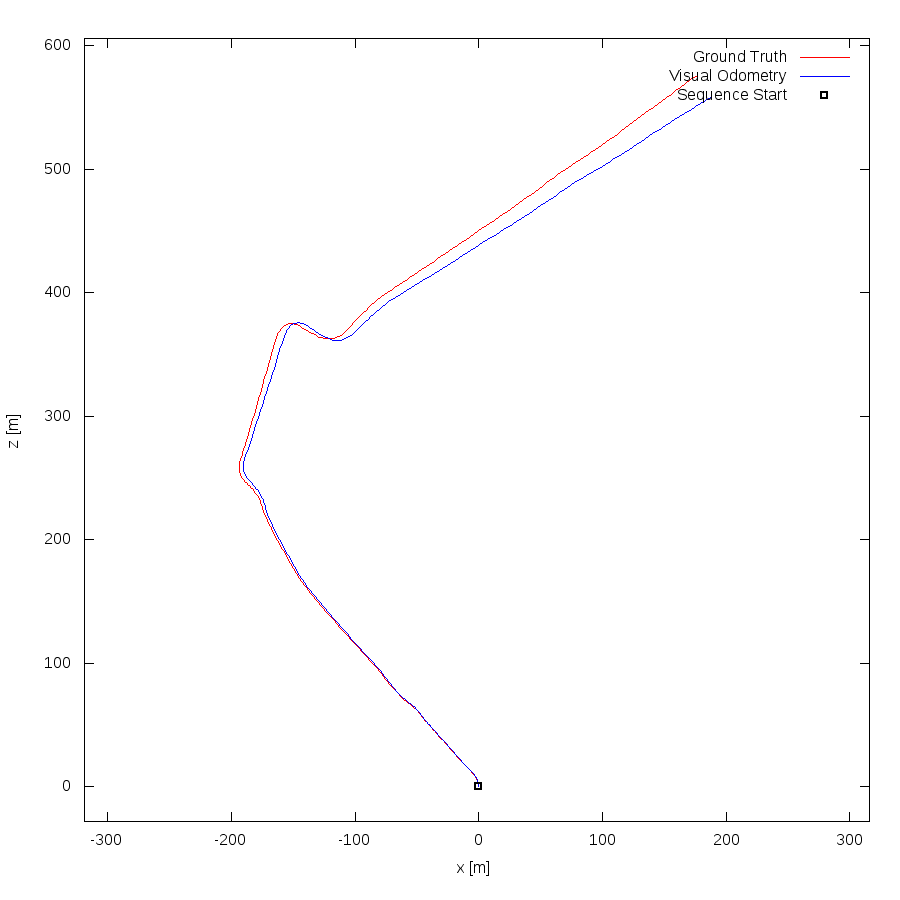
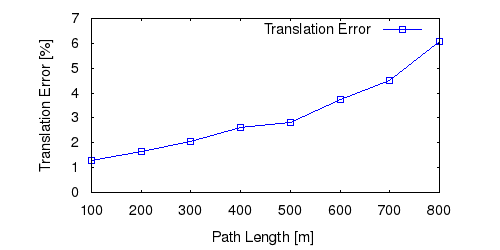
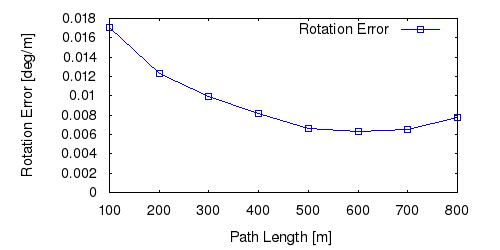
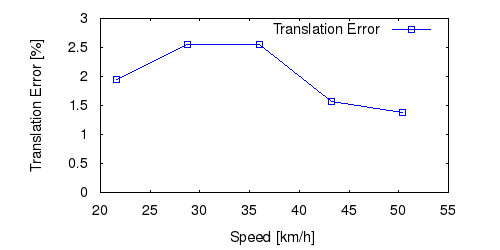
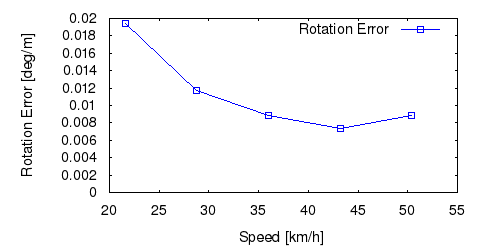
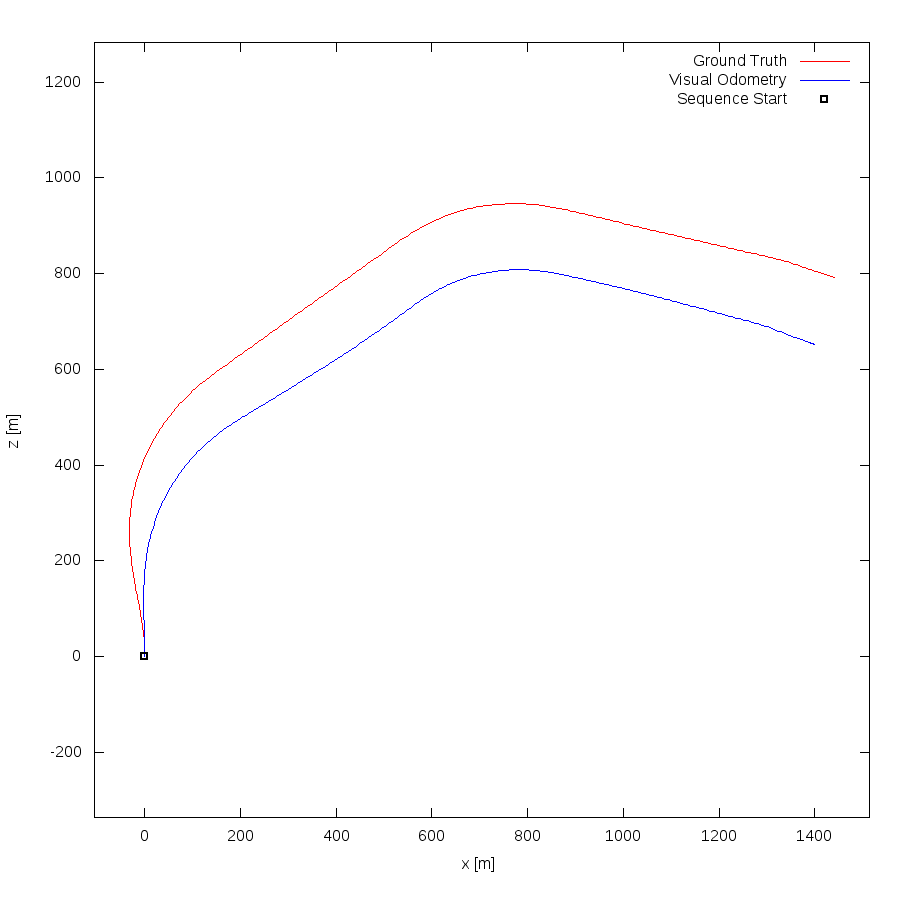
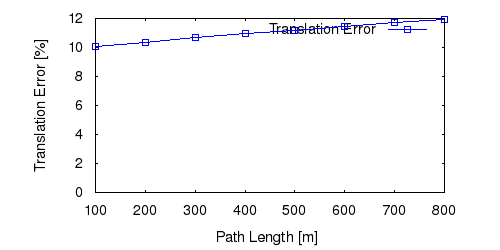
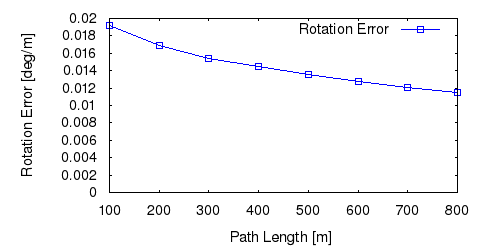
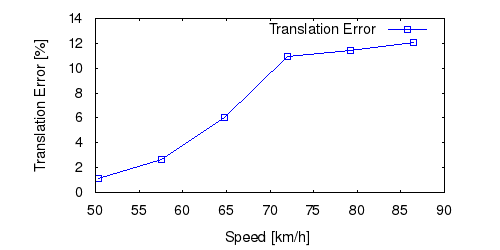
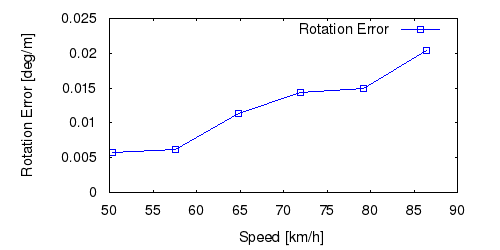
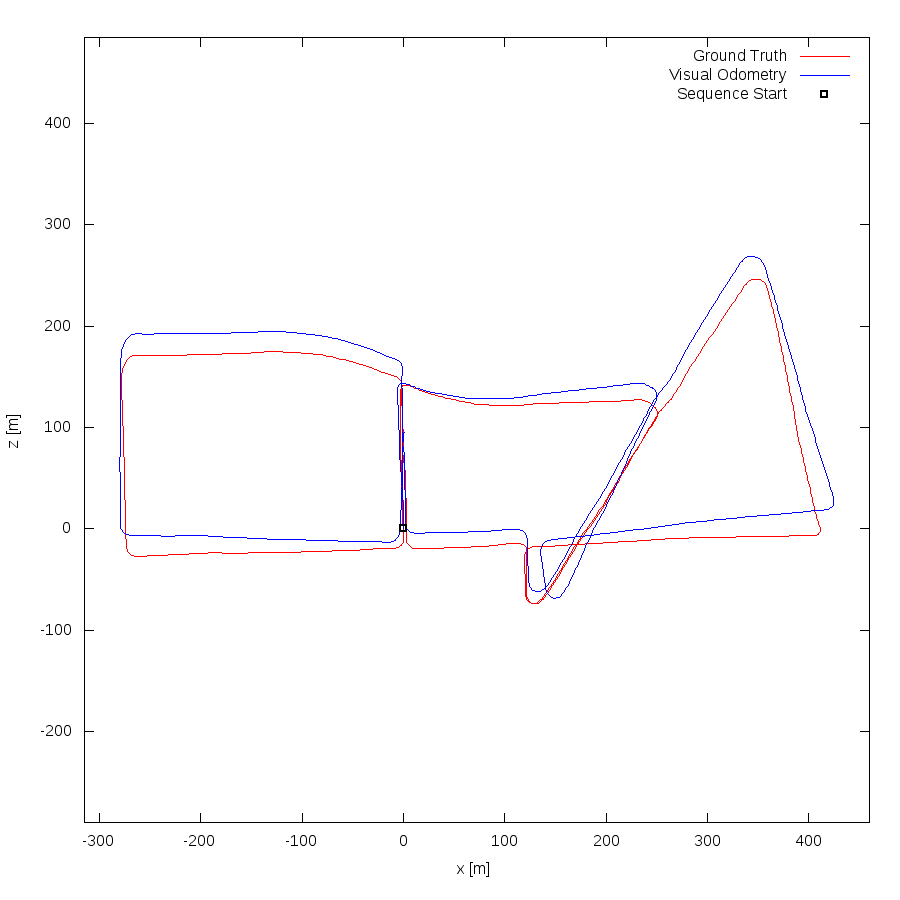
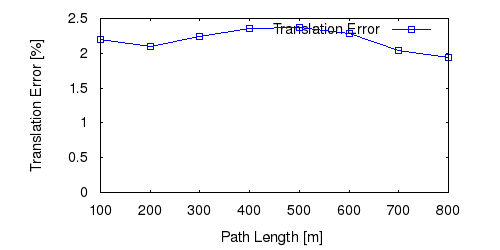
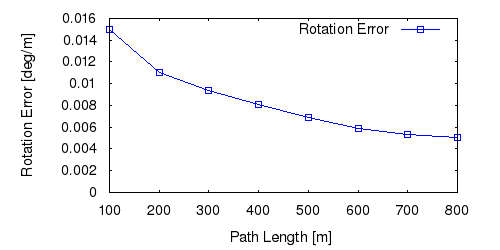
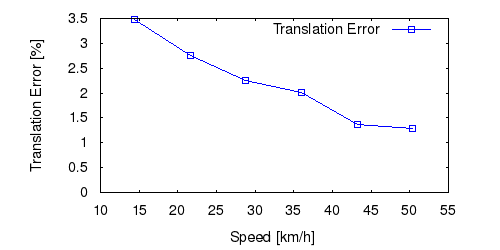
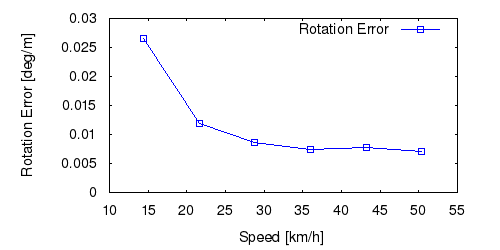
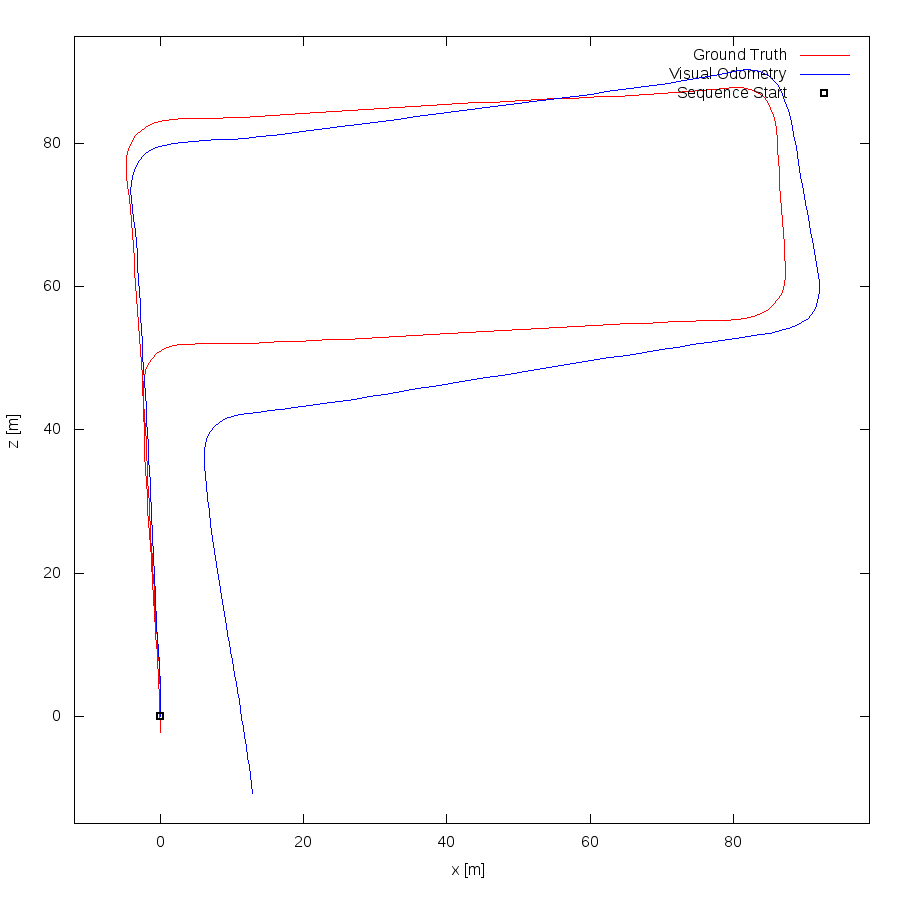
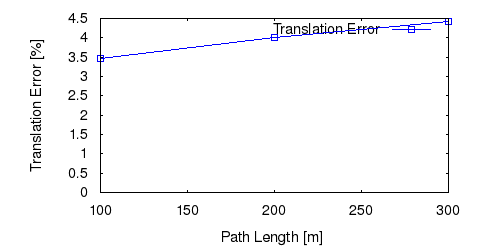
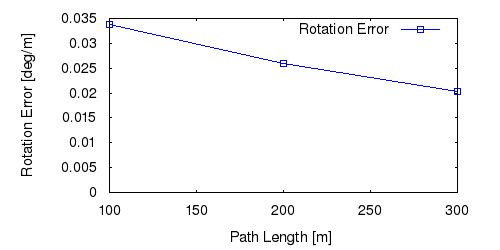
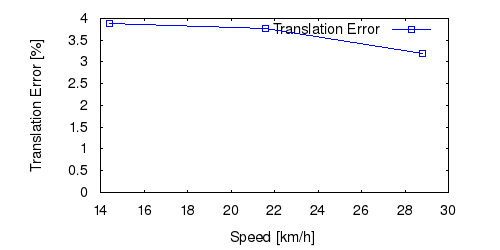
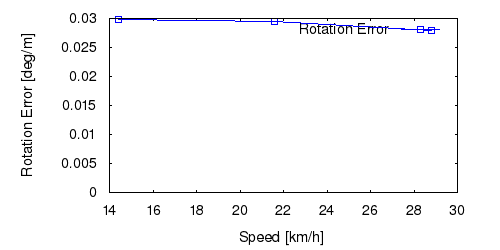
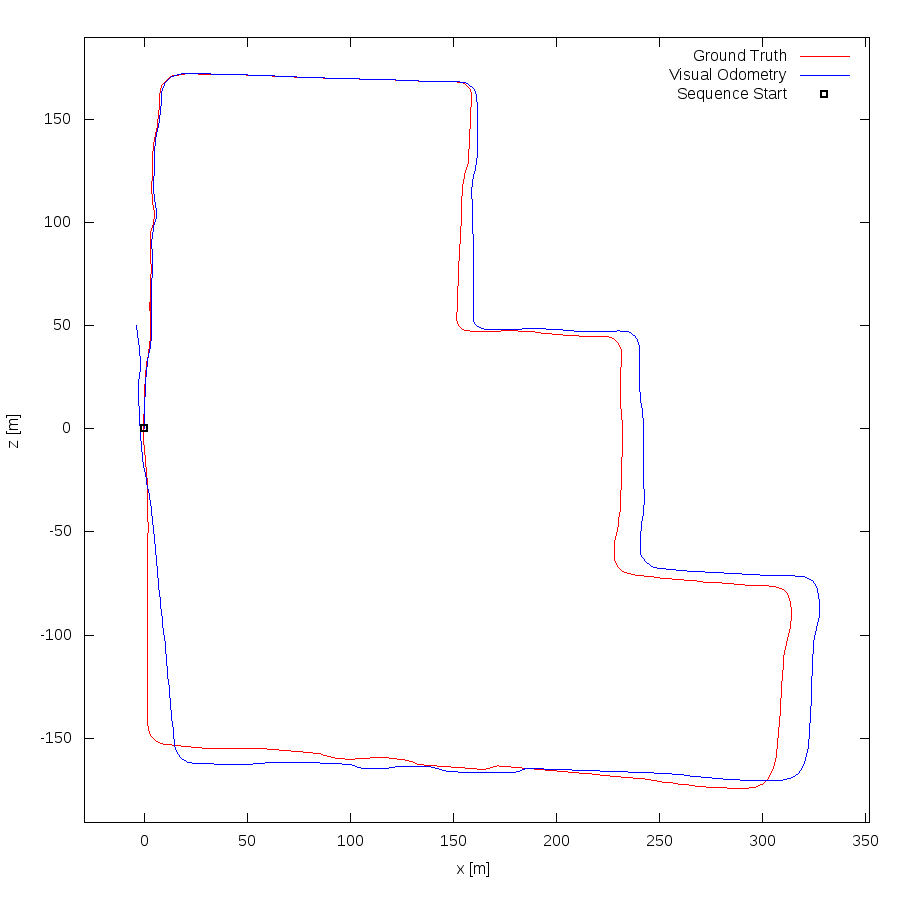
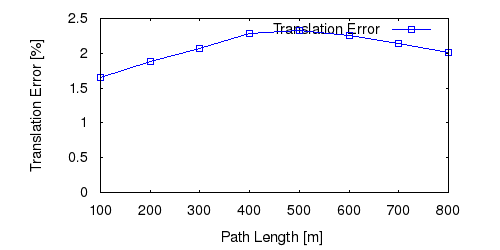
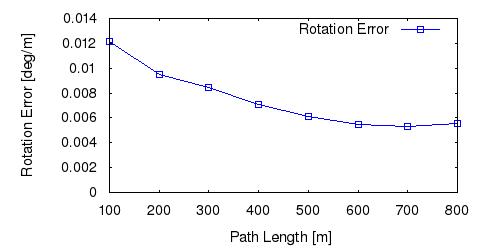
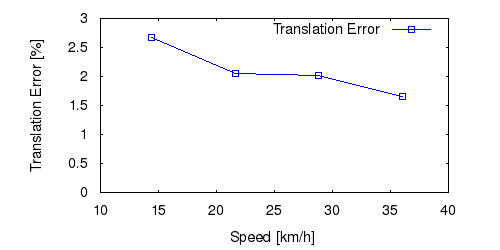
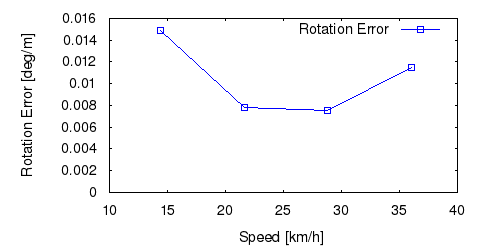
From all test sequences (sequences 11-21), our benchmark computes translational and rotational errors for all possible subsequences of length (5,10,50,100,150,...,400) meters. Our evaluation ranks methods according to the average of those values, where errors are measured in percent (for translation) and in degrees per meter (for rotation). Details for different trajectory lengths and driving speeds can be found in the plots underneath. Furthermore, the first 5 test trajectories and error plots are shown below.

Test Set Average


This figure as: png eps pdf txt gnuplot


This figure as: png eps pdf txt gnuplot


This figure as: png eps pdf txt gnuplot


This figure as: png eps pdf txt gnuplot


Sequence 11


This figure as: png eps pdf txt gnuplot


This figure as: png eps pdf txt gnuplot


This figure as: png eps pdf txt gnuplot


This figure as: png eps pdf txt gnuplot


This figure as: png eps pdf txt gnuplot


Sequence 12


This figure as: png eps pdf txt gnuplot


This figure as: png eps pdf txt gnuplot


This figure as: png eps pdf txt gnuplot


This figure as: png eps pdf txt gnuplot


This figure as: png eps pdf txt gnuplot


Sequence 13


This figure as: png eps pdf txt gnuplot


This figure as: png eps pdf txt gnuplot


This figure as: png eps pdf txt gnuplot


This figure as: png eps pdf txt gnuplot


This figure as: png eps pdf txt gnuplot


Sequence 14


This figure as: png eps pdf txt gnuplot


This figure as: png eps pdf txt gnuplot


This figure as: png eps pdf txt gnuplot


This figure as: png eps pdf txt gnuplot


This figure as: png eps pdf txt gnuplot


Sequence 15


This figure as: png eps pdf txt gnuplot


This figure as: png eps pdf txt gnuplot


This figure as: png eps pdf txt gnuplot


This figure as: png eps pdf txt gnuplot


This figure as: png eps pdf txt gnuplot


eXTReMe Tracker