Important note: On September 7, 2026, the KITTI and KITTI-360 servers had to be restored to the backed-up state of August 7, 2026. Results within this period have to be resubmitted.

Method

Resource-Aware GPU Computing for Real-Time Stereo Disparity Estimation [RAGC-Stereo]


Submitted on 18 Sep. 2026 22:46 by
Abiel Aguilar-González (National Institute of Astrophysics, Optics and Electronics (INAOE), Mexico)

Running time:0.005076 s
Environment:GPU @ 2.5 Ghz (C/C++)

Method Description:
Segment-oriented classical stereo pipeline
implemented in C++/CUDA, without any trained
model. Truncated gradient-domain matching costs
(5x5 derivative filters) are computed per pixel
and disparity candidate, aggregated into Turbo
Pixel segment cost vectors, and regularized by
restart-based propagation over a row-normalized
segment graph for each view, with a segment-level
left-right visibility test applied after each
pass. The final disparity is the argmin of a
weighted sum of the preserved pixel-level costs
and the refined segment costs, and inconsistent
segments receive zero disparity. All stages run on
the GPU with a fixed number of propagation passes.
Parameters:
d_max=128, tau_g=2, C_invalid=4, Turbo Pixel size
rho=7, edge weight (tau, sigma)=(0.2, 10), restart
lambda=0.0015, propagation passes k=100, visibility
threshold tau_v=1, neighborhood capacity=100,
(lambda_1, lambda_2)=(0.0005, 0.9995). Mean running
time per stereo pair: 5.08 ms (197 FPS), NVIDIA RTX
3080 Laptop GPU, C++/CUDA.
Latex Bibtex:
@article{aguilar2026ragc,
title={Resource-Aware GPU Computing for Real-
Time Stereo Disparity Estimation on Embedded
Platforms},
author={Aguilar-Gonz{\'a}lez, Abiel and Medina
Santiago, Alejandro and Osuna-Couti{\~n}o, J. A.
de Jes{\'u}s and Torres Villanueva, Jos{\'e}
Humberto and L{\'o}pez-P{\'e}rez, Luis Adri{\'a}n
and P{\'e}rez Patricio, Mada{\'\i}n and Morales-
Navarro, N. A.},
year={2026},
note={Manuscript submitted for publication}
}

Detailed Results

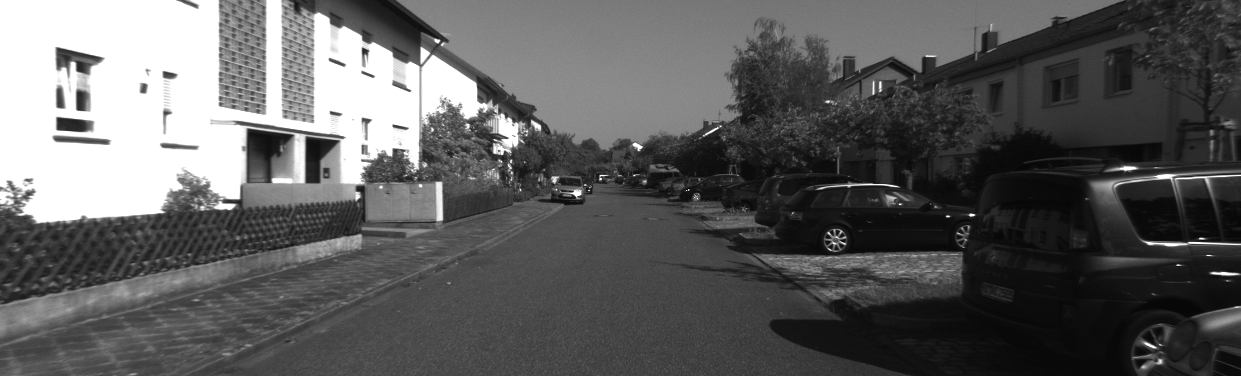
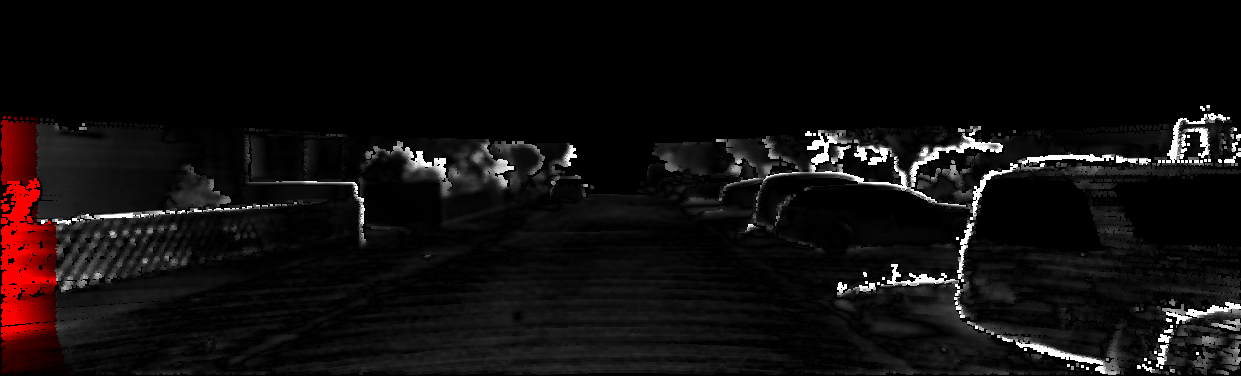
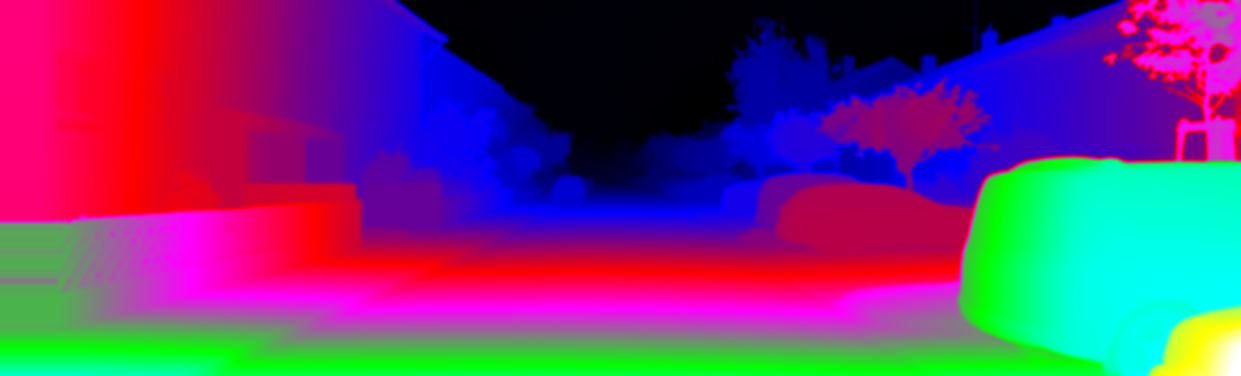
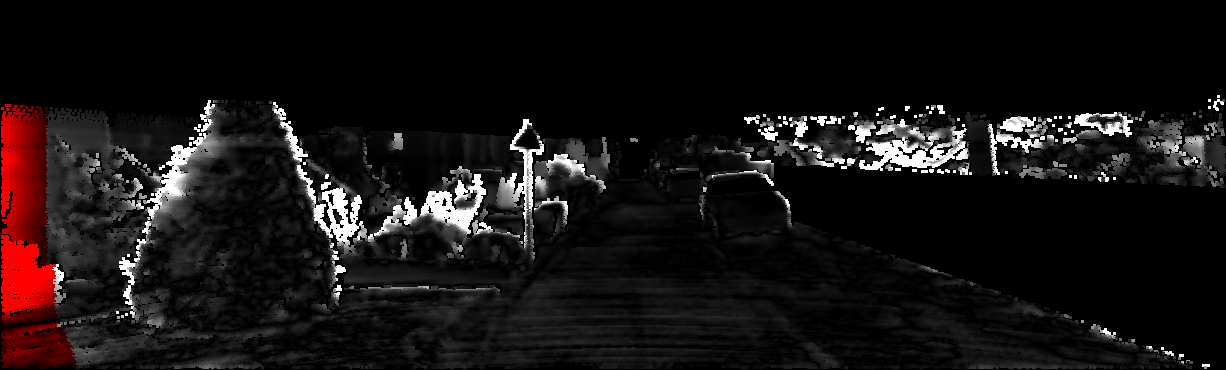
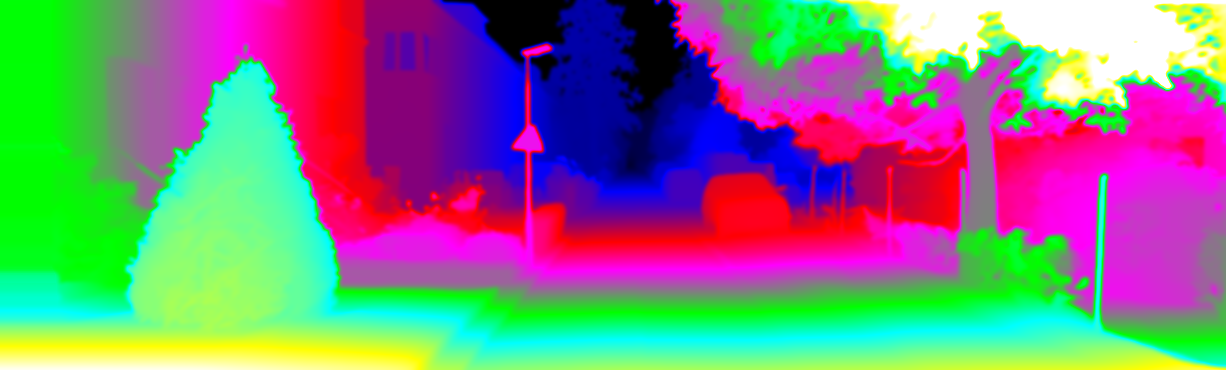
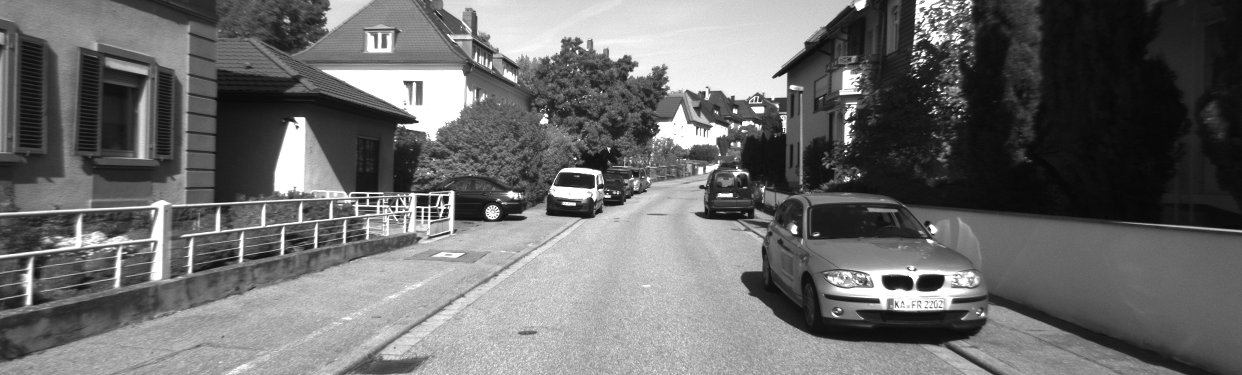
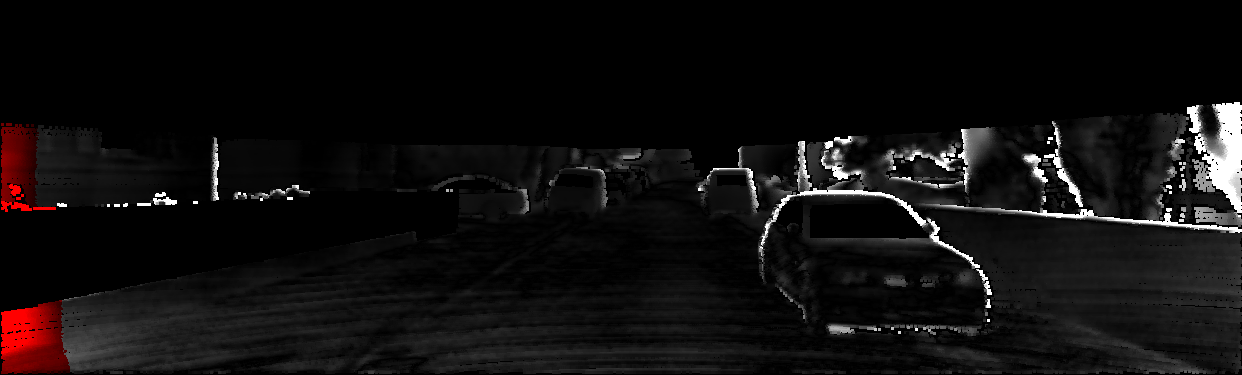
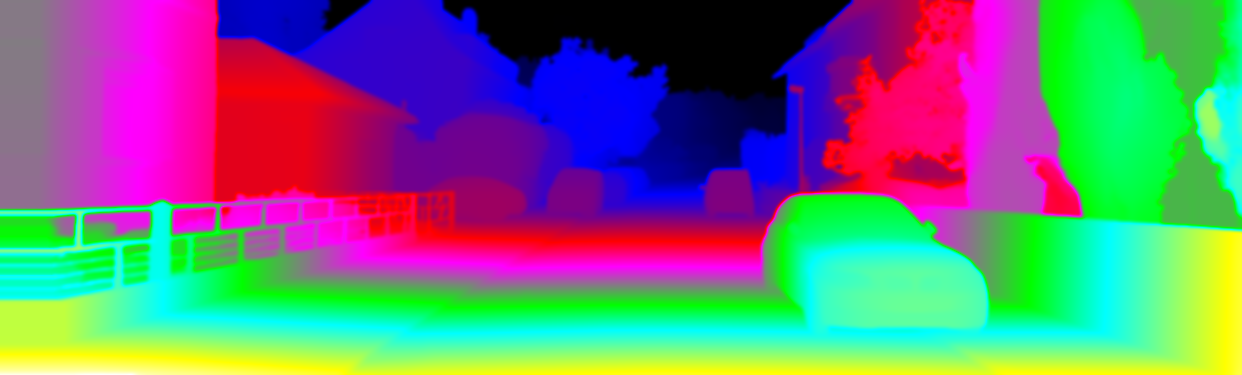
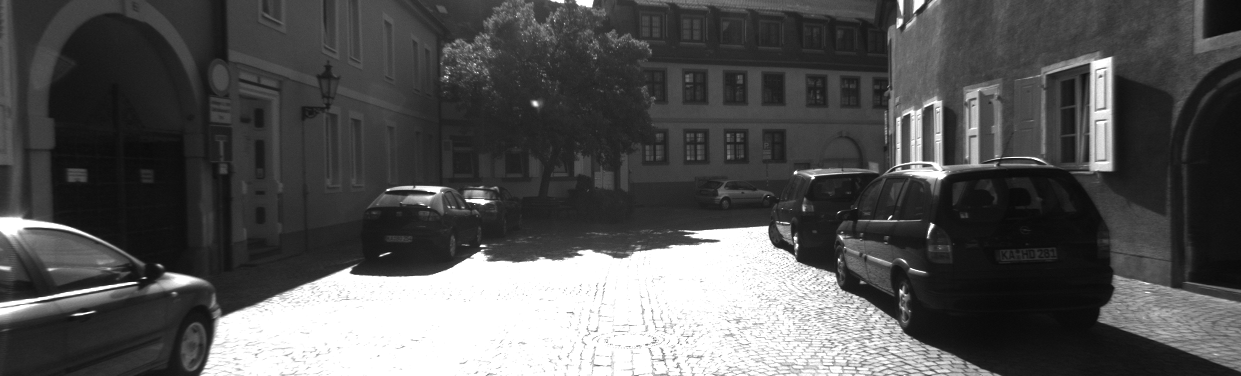
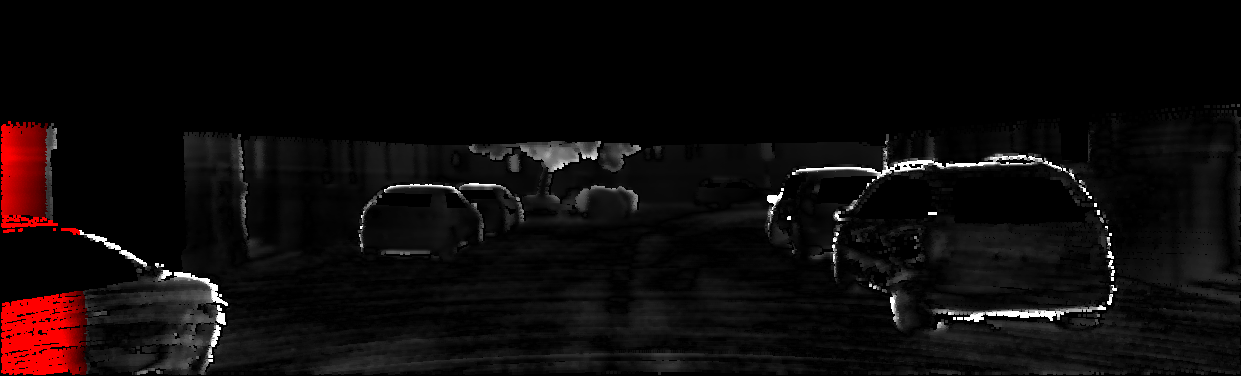
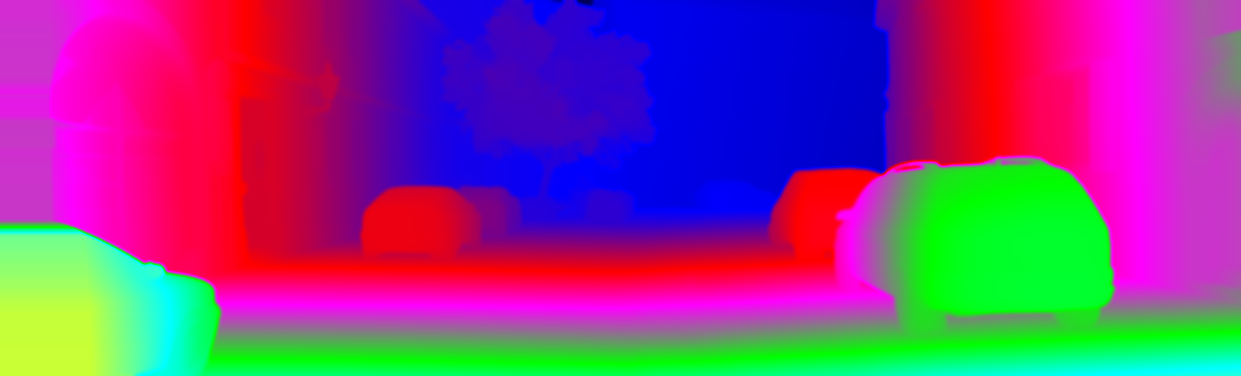
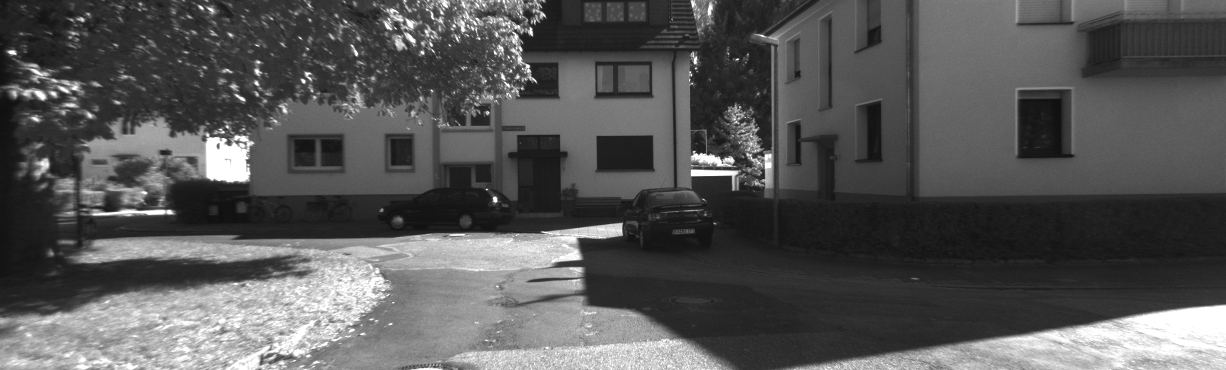
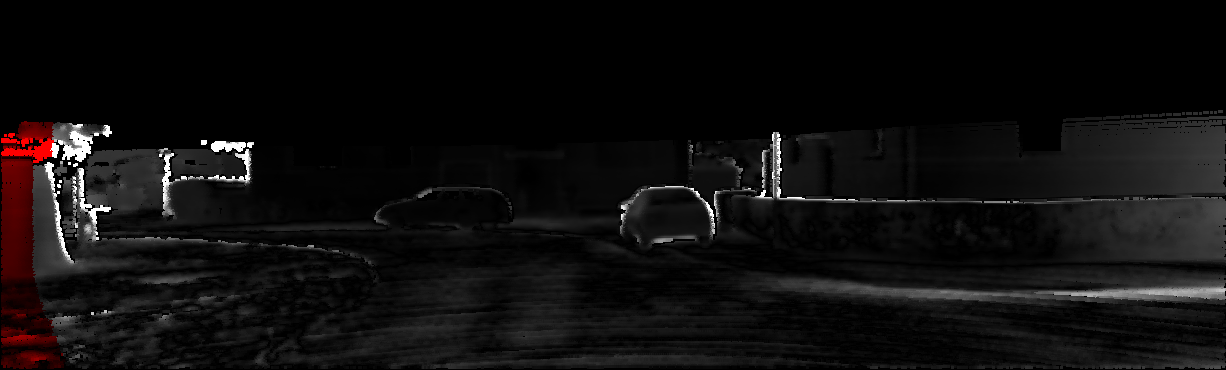
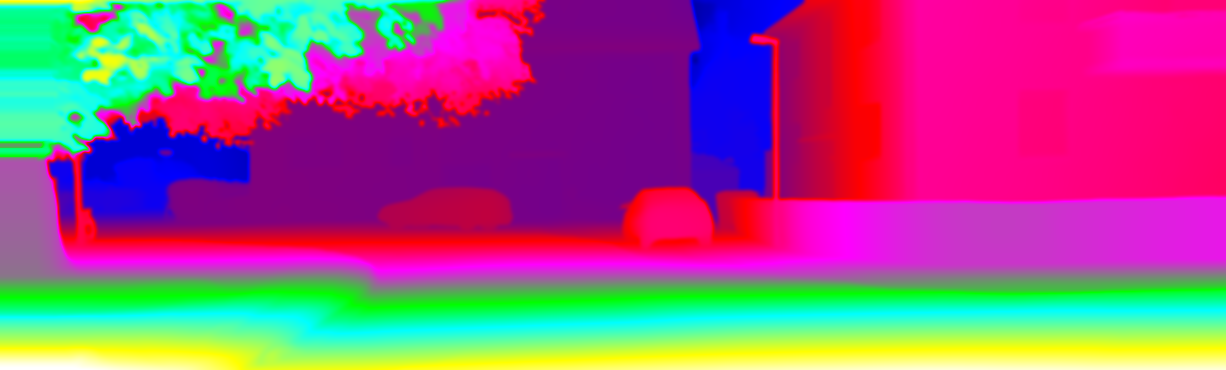
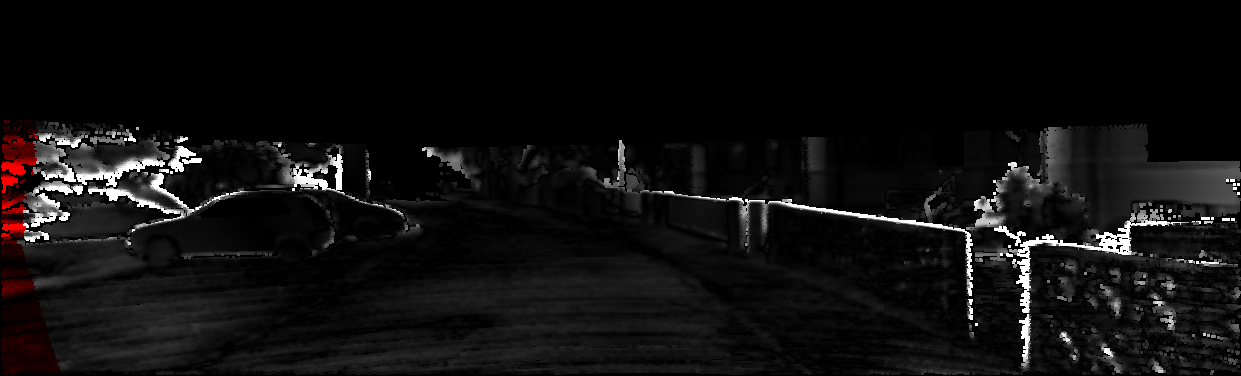
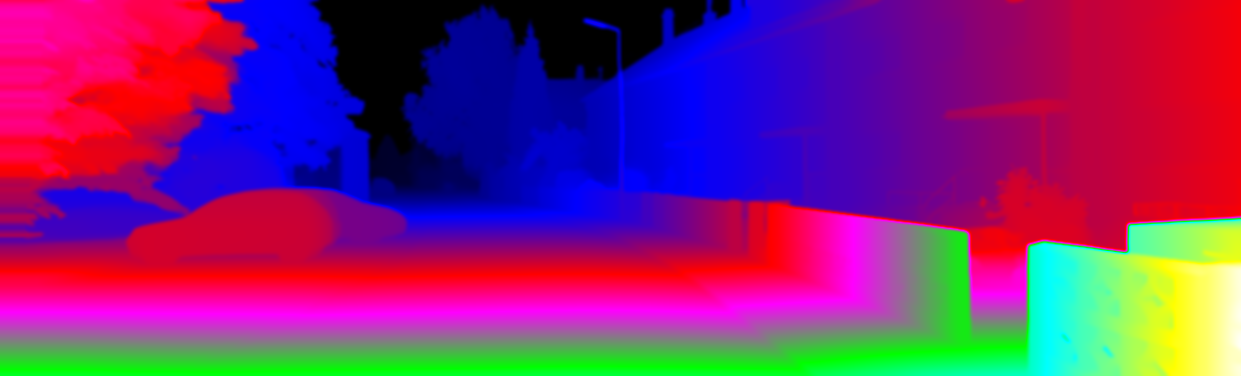
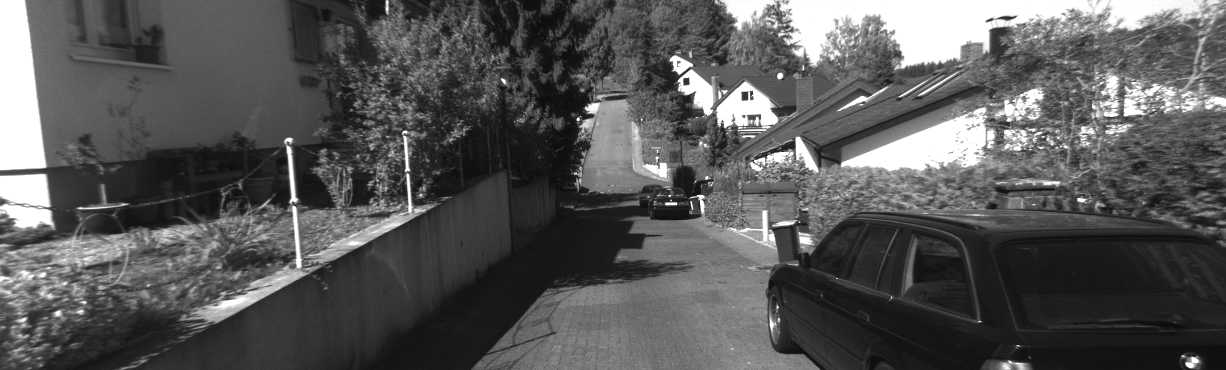
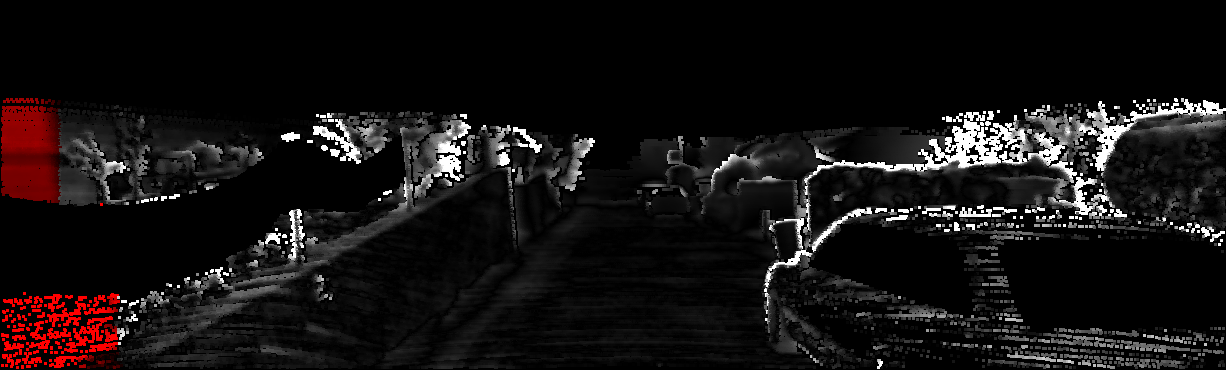
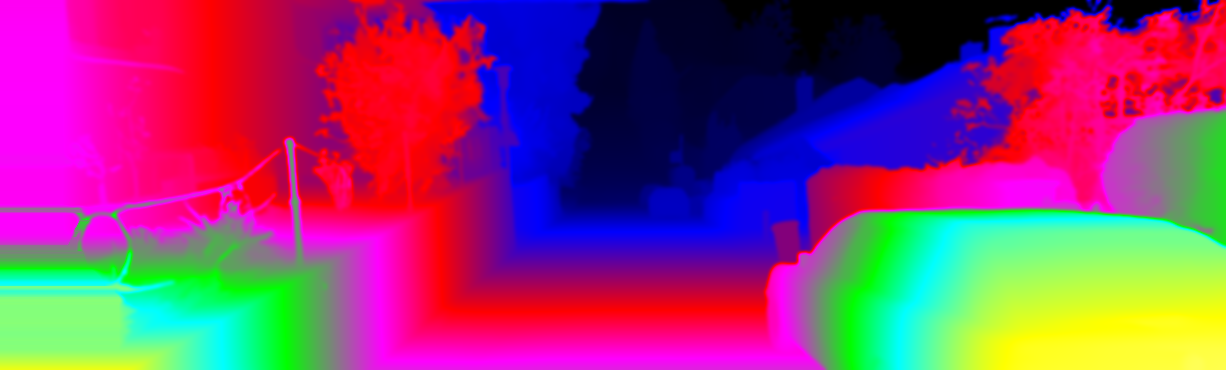
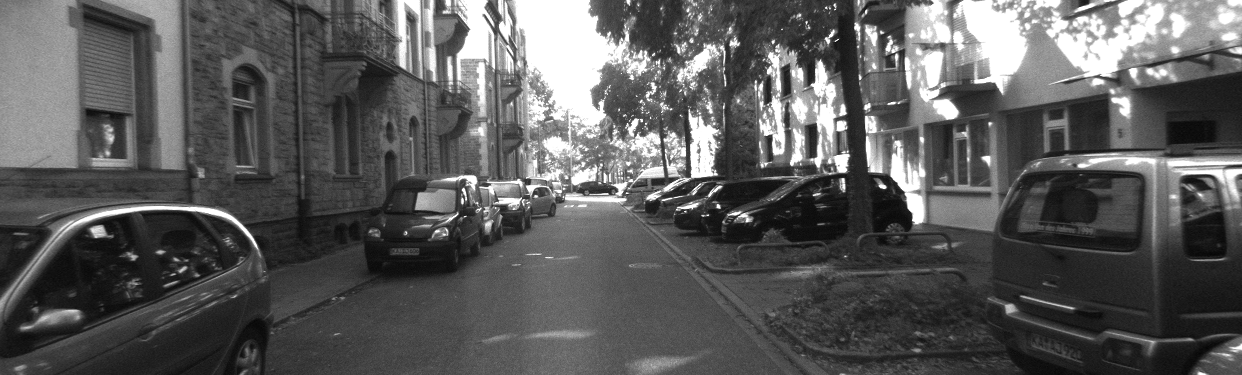
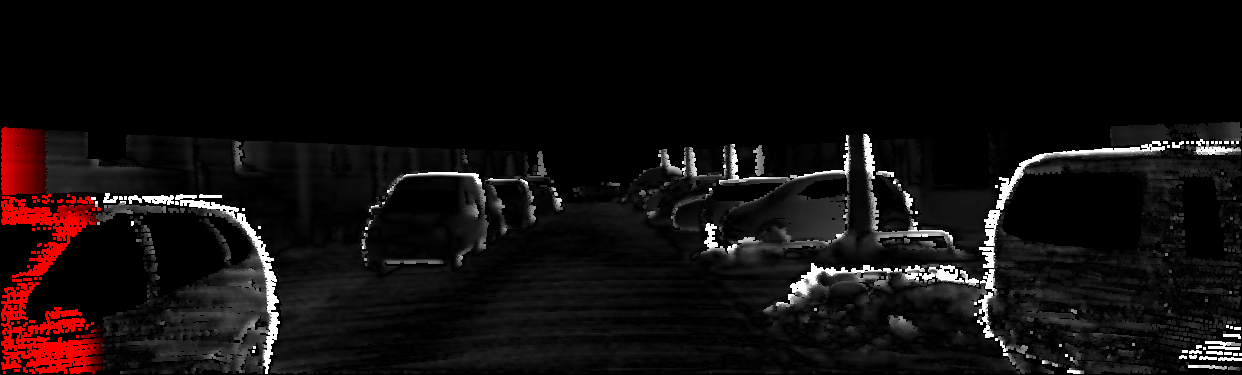
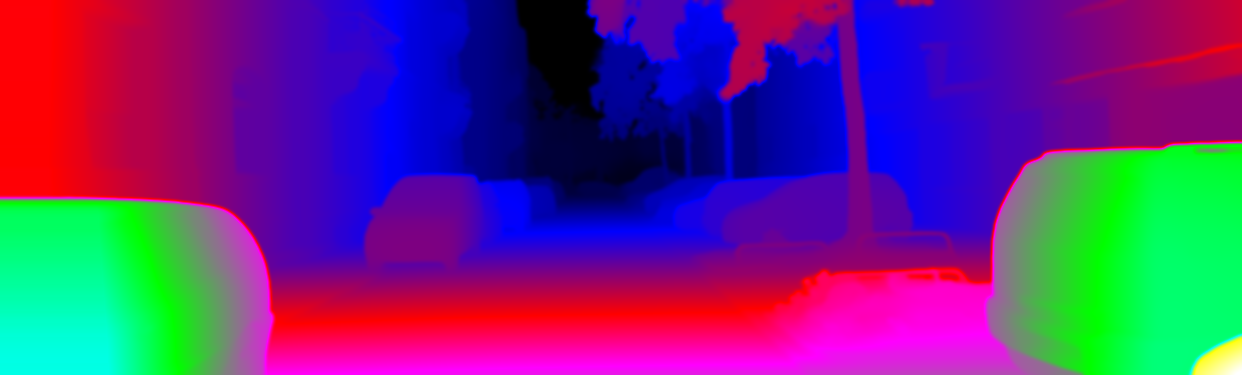
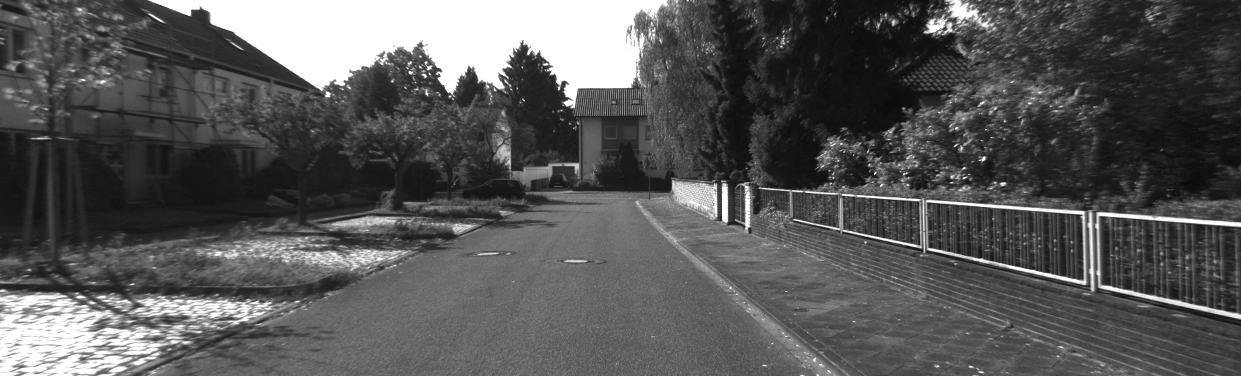
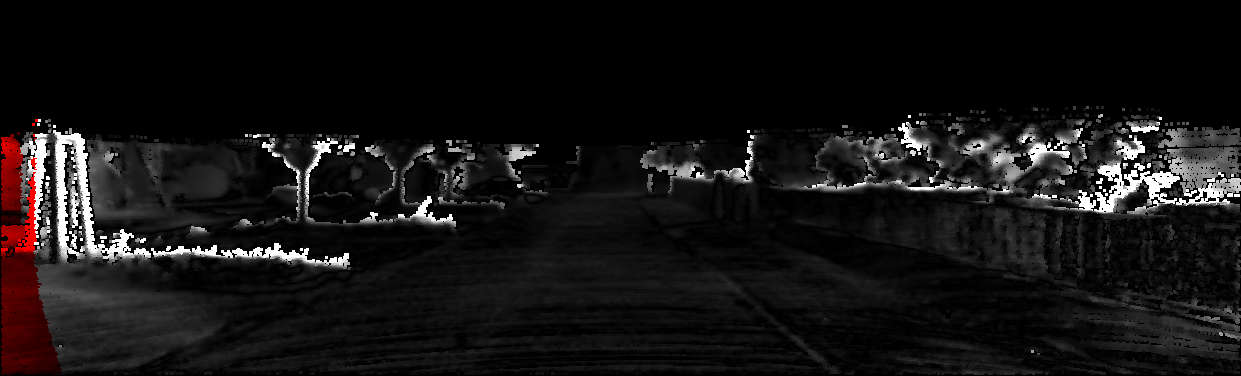
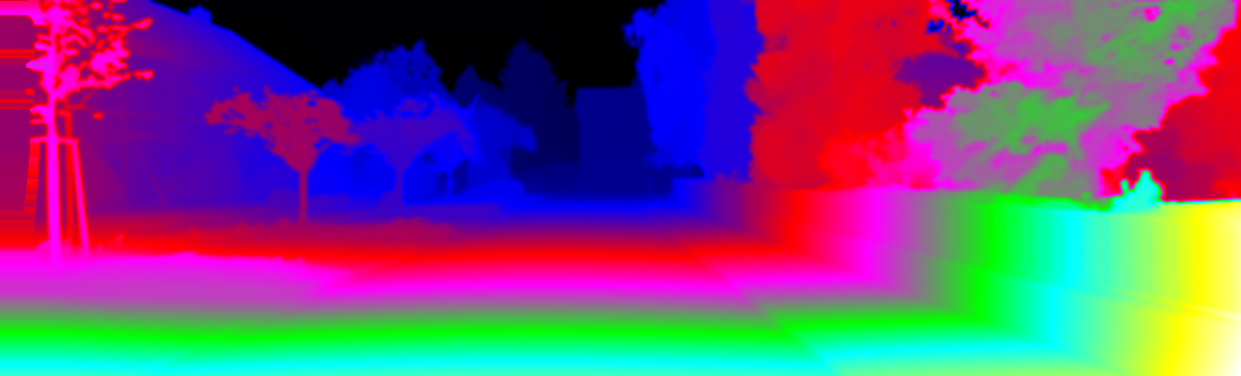
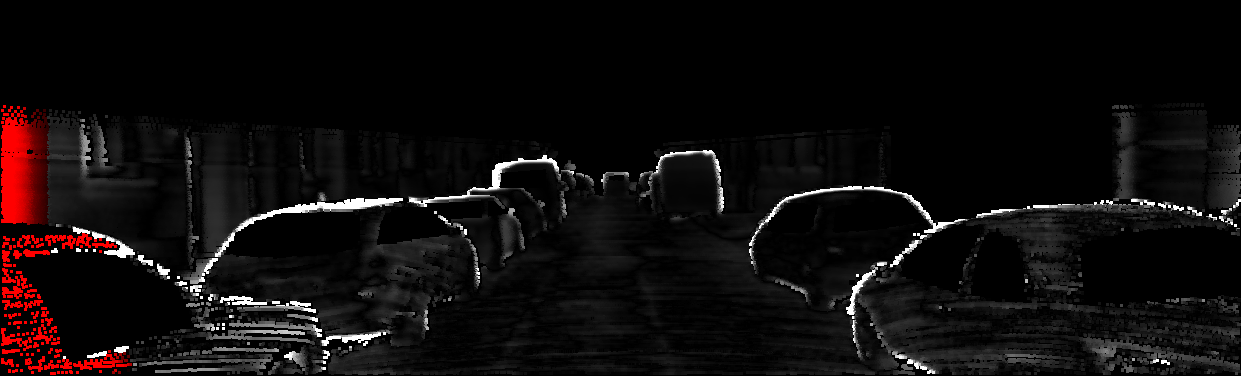
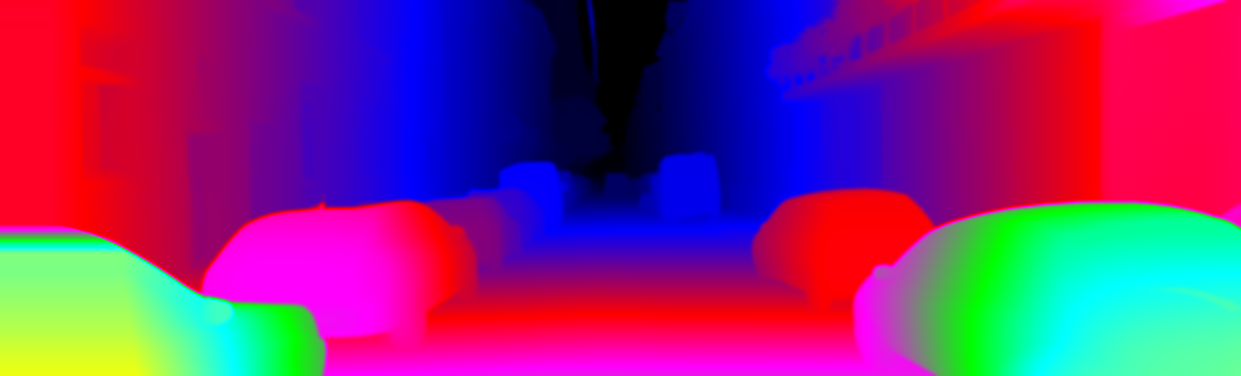
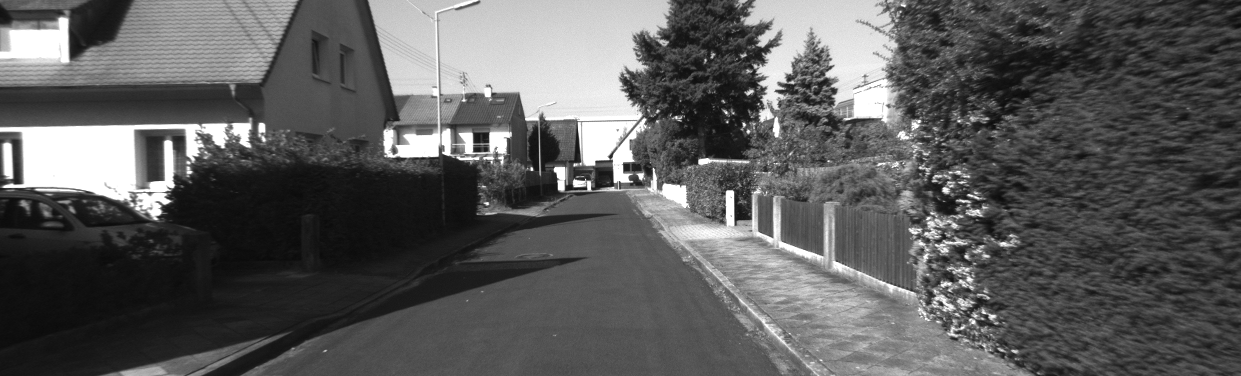
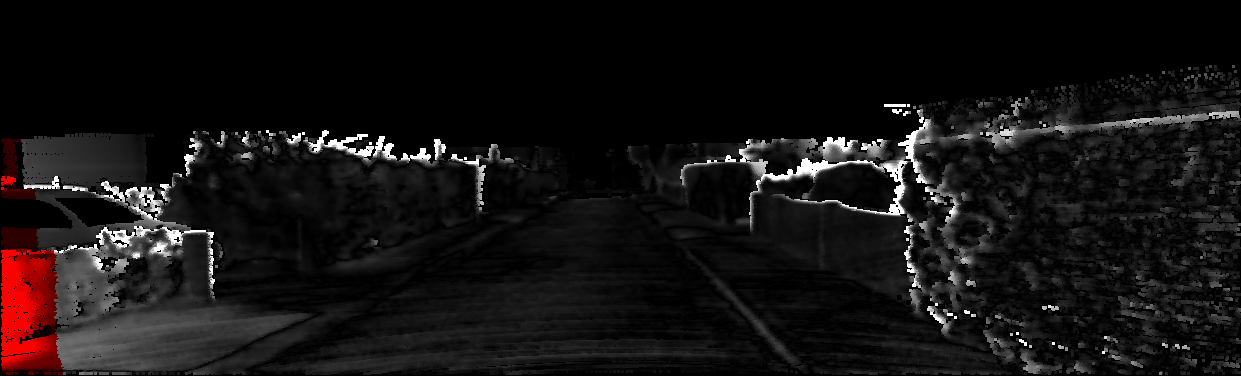
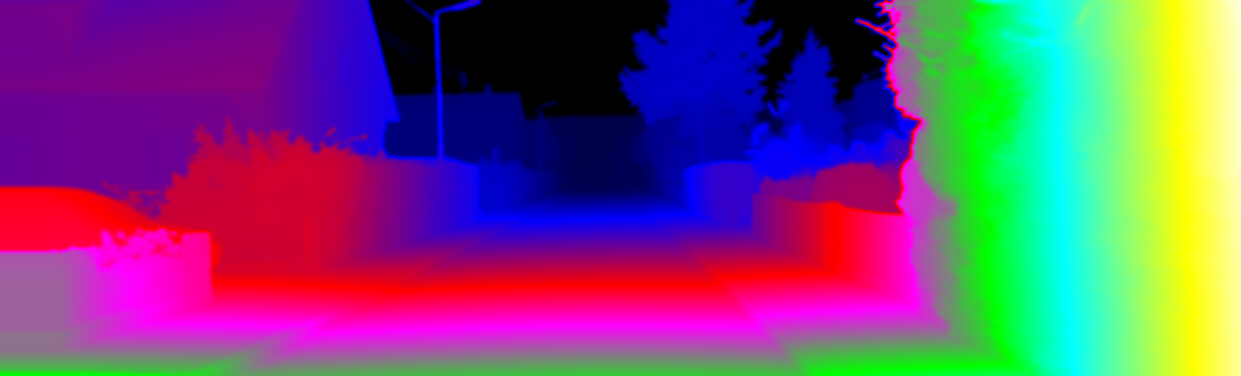
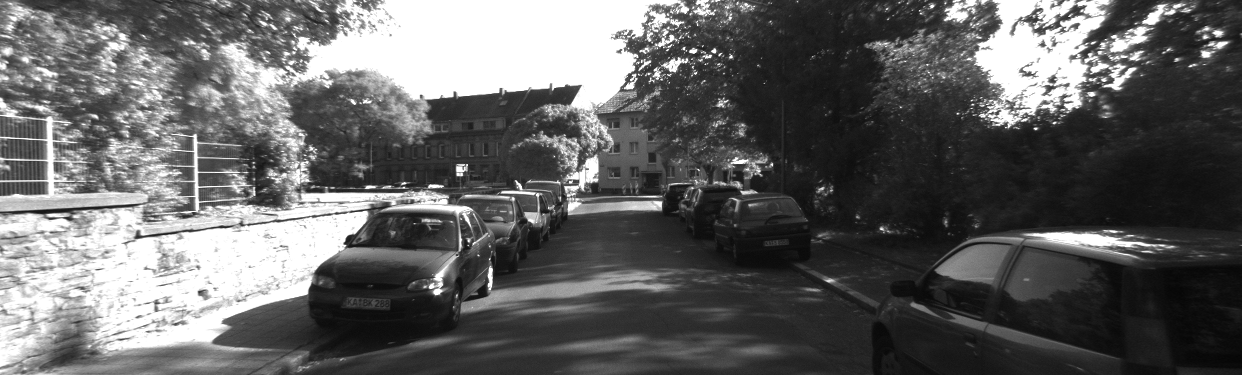
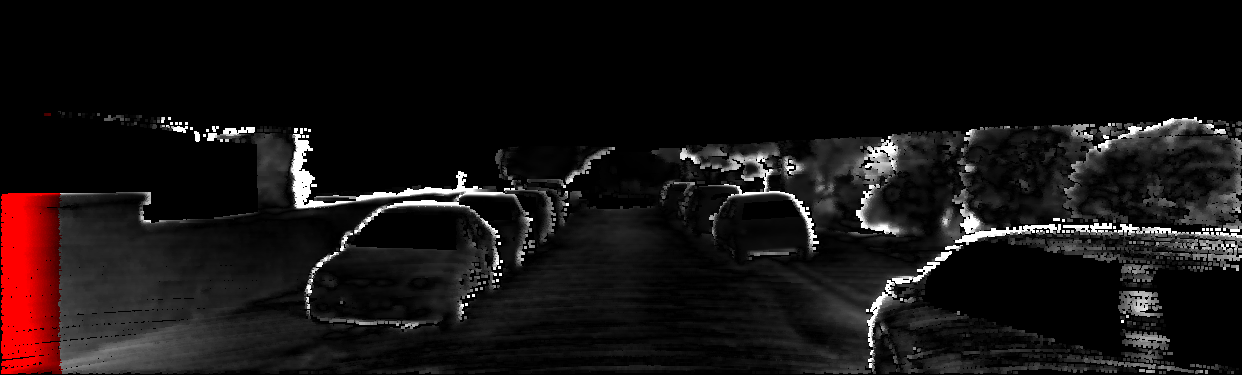
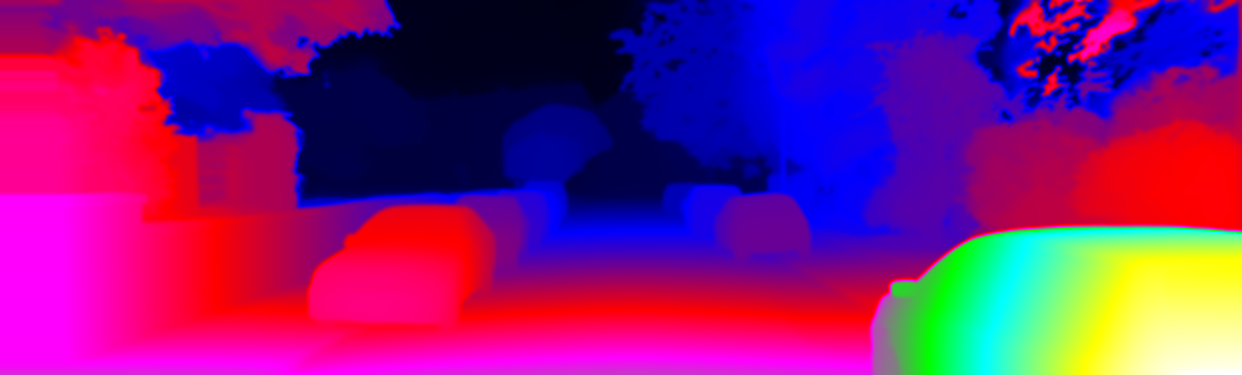
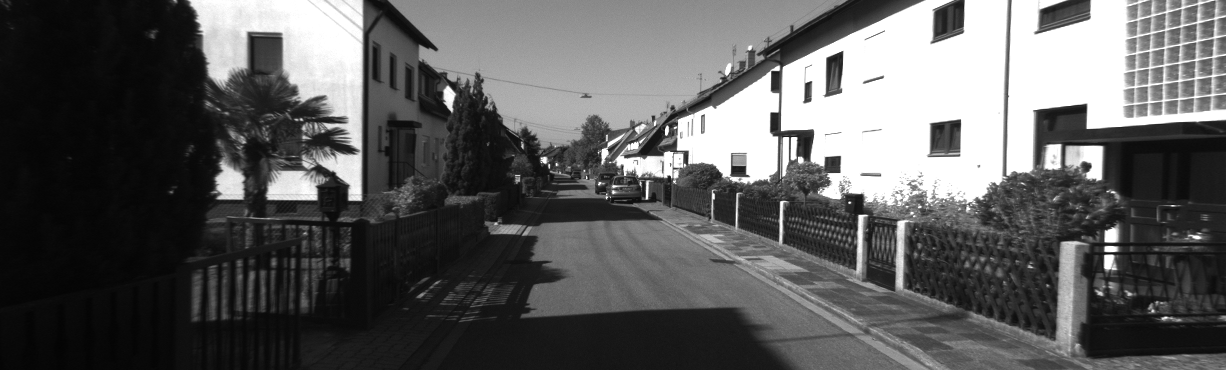
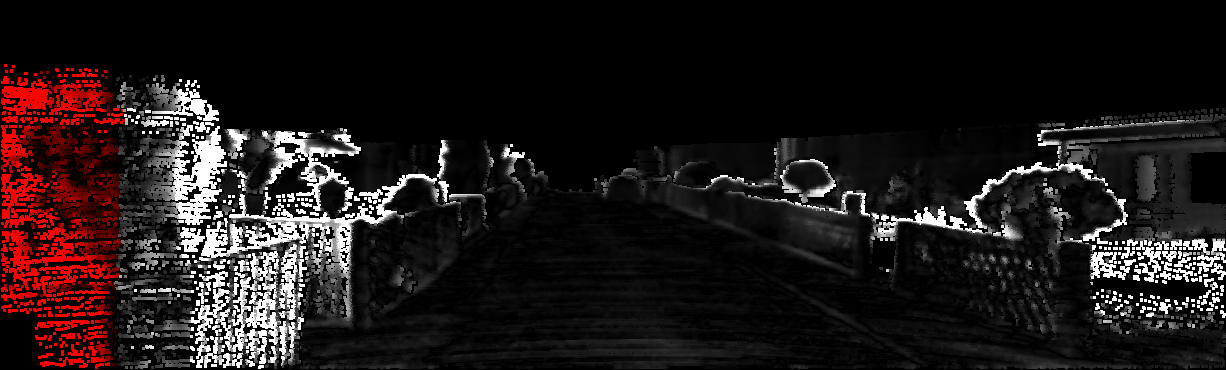
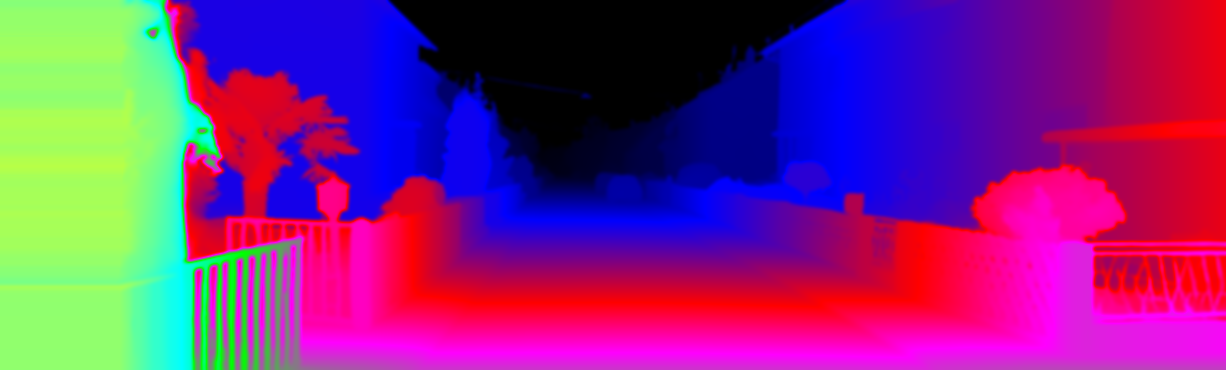
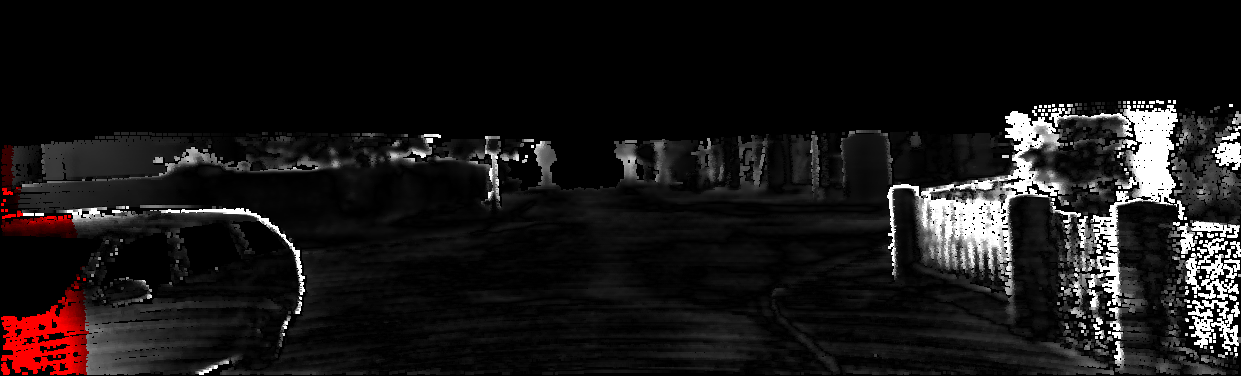
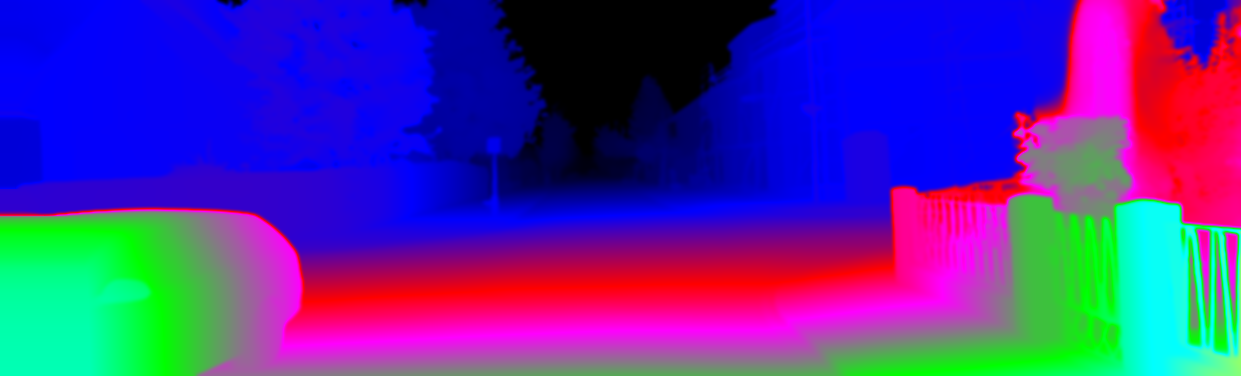
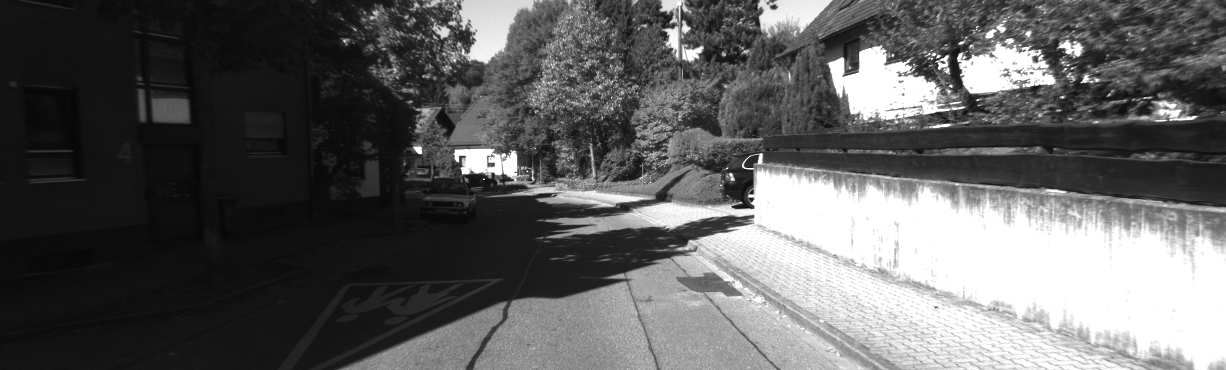
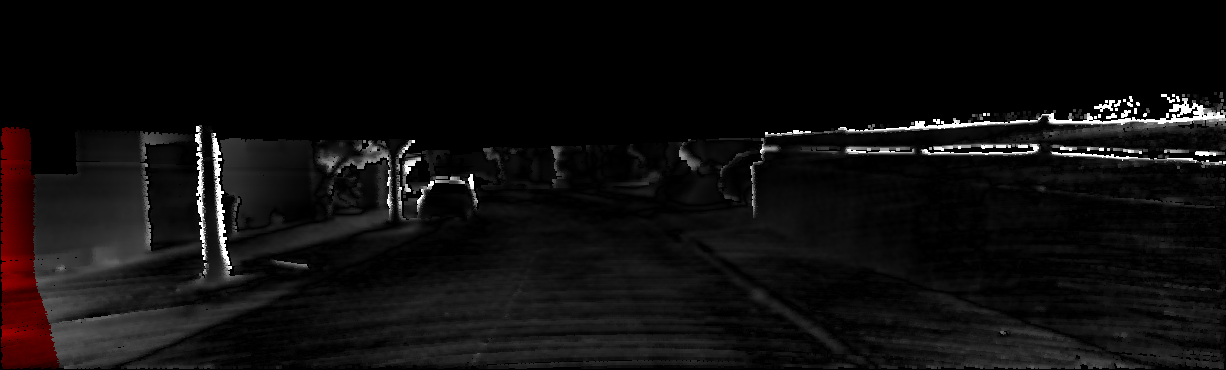
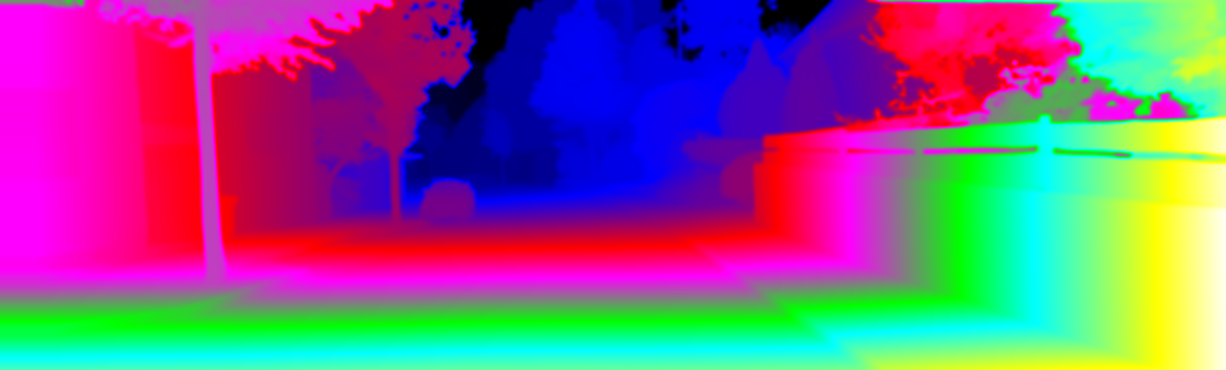
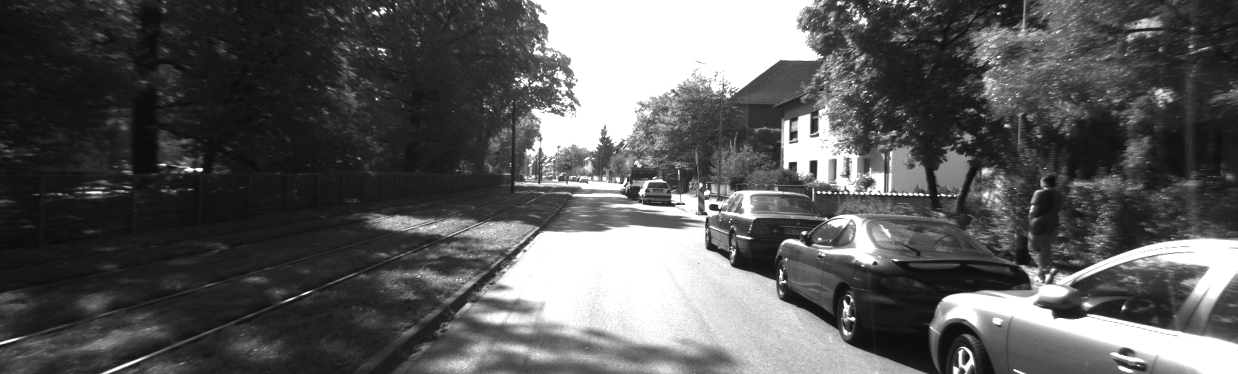
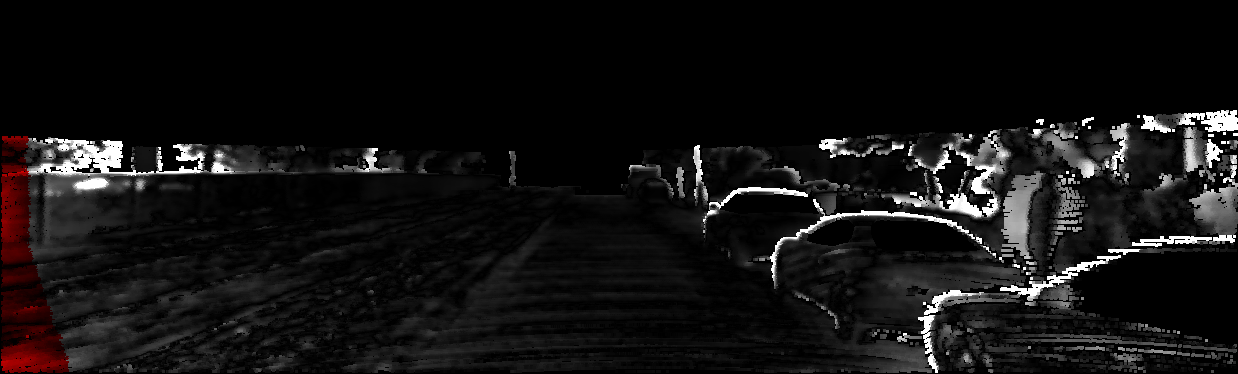
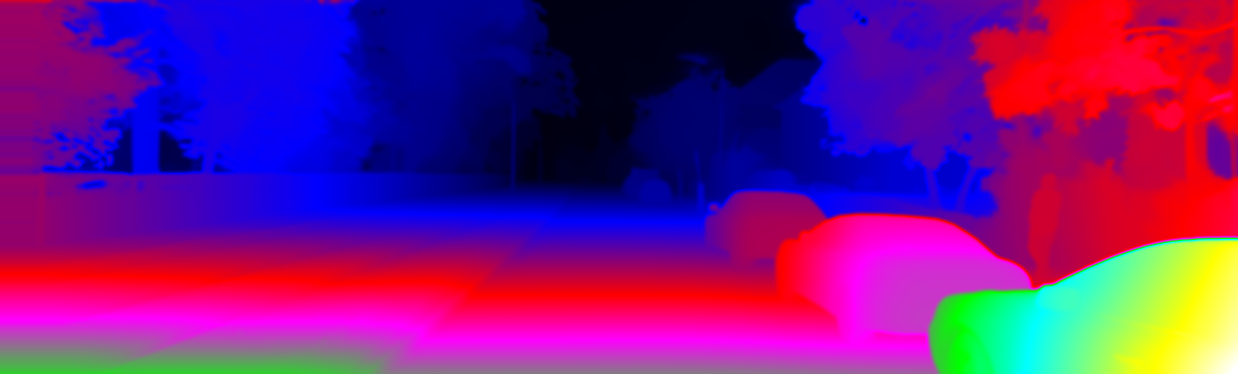
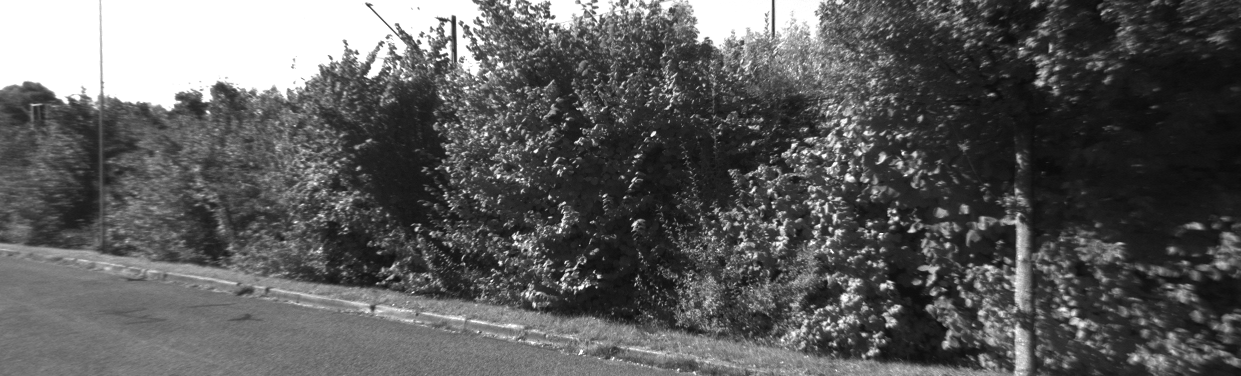
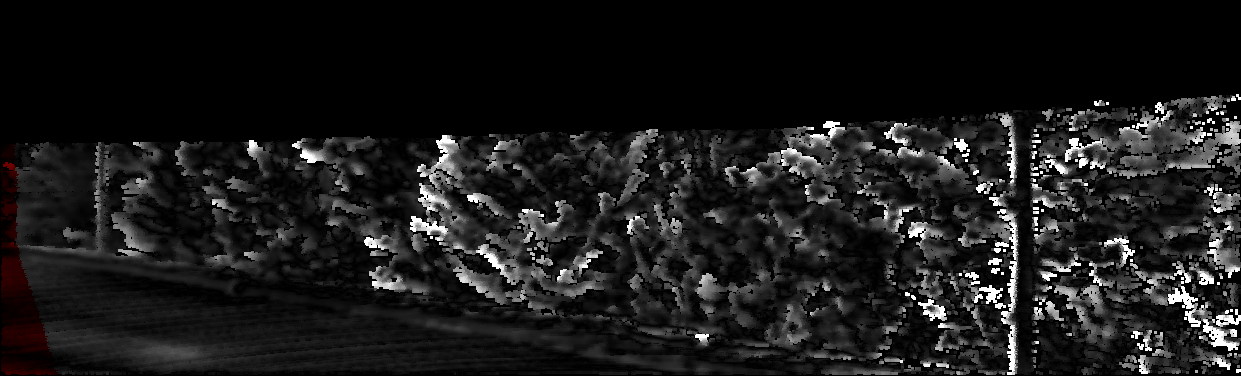
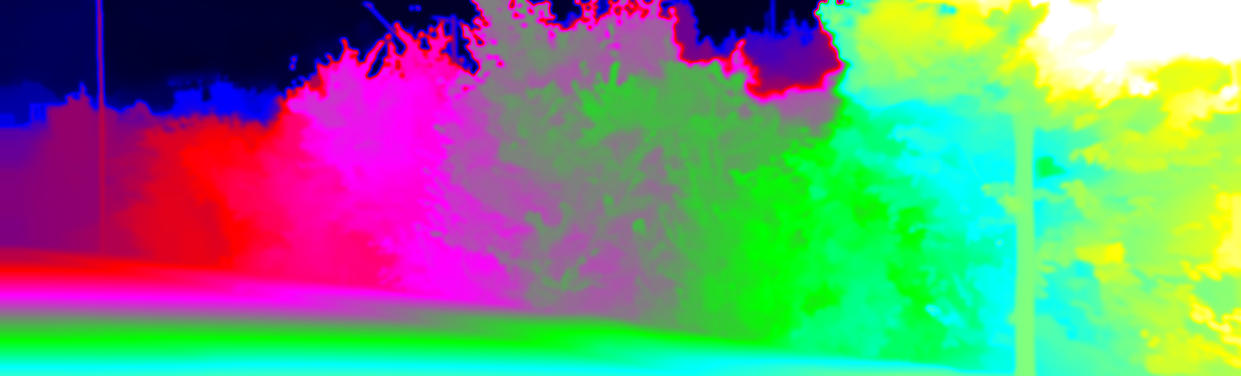
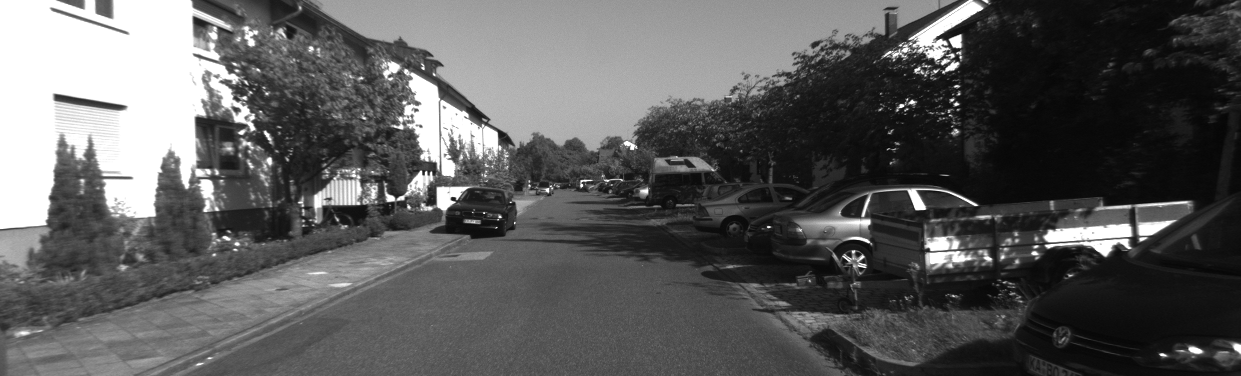
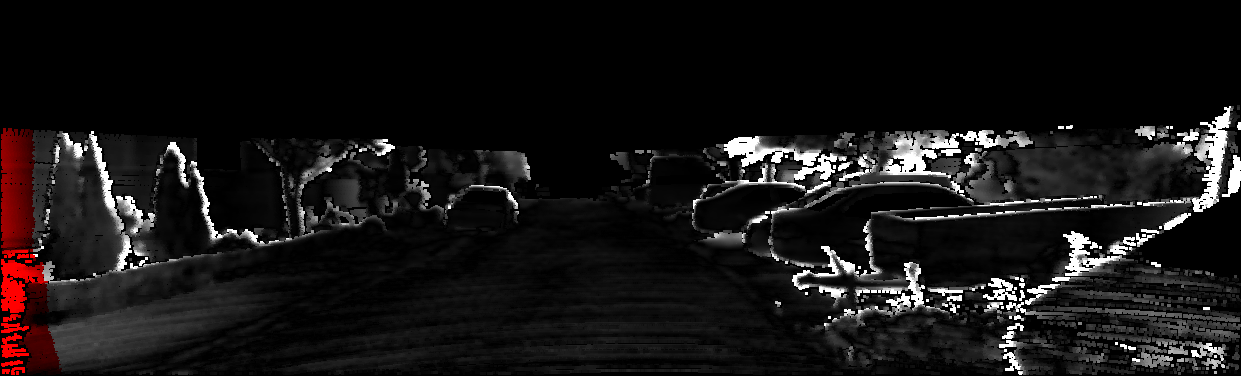
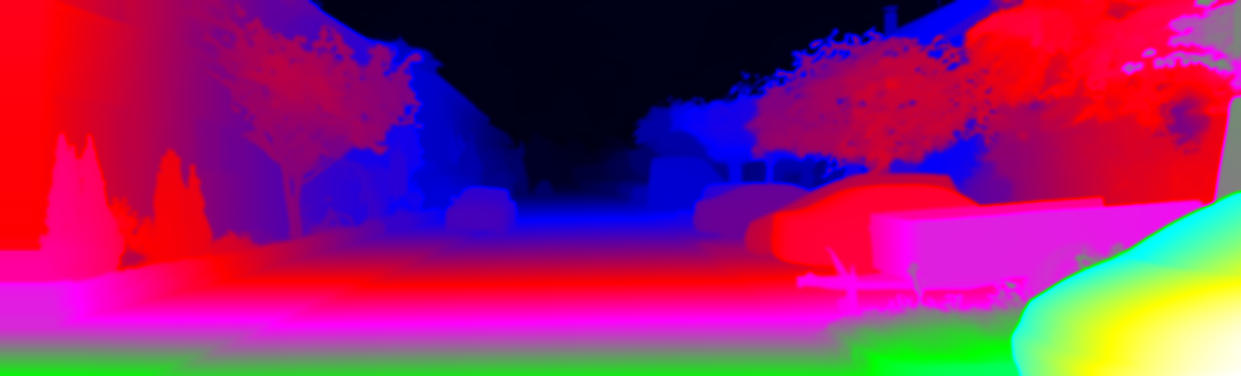
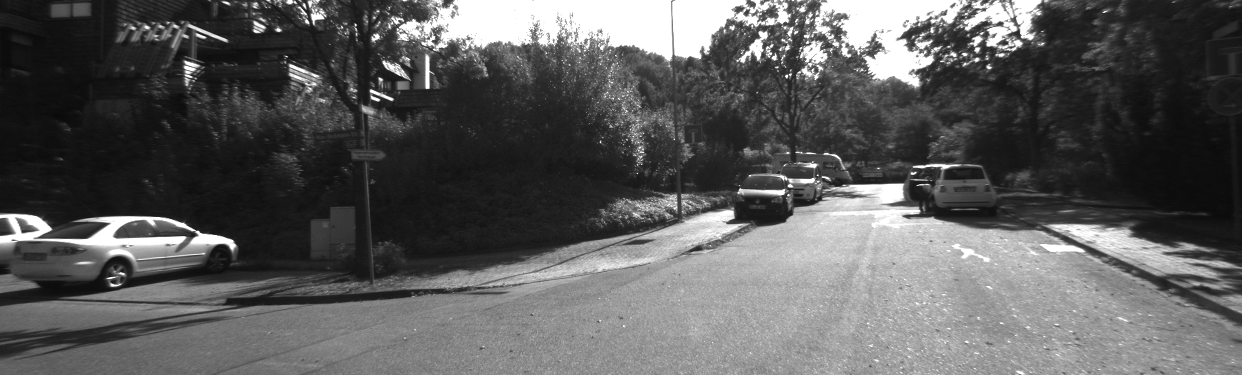
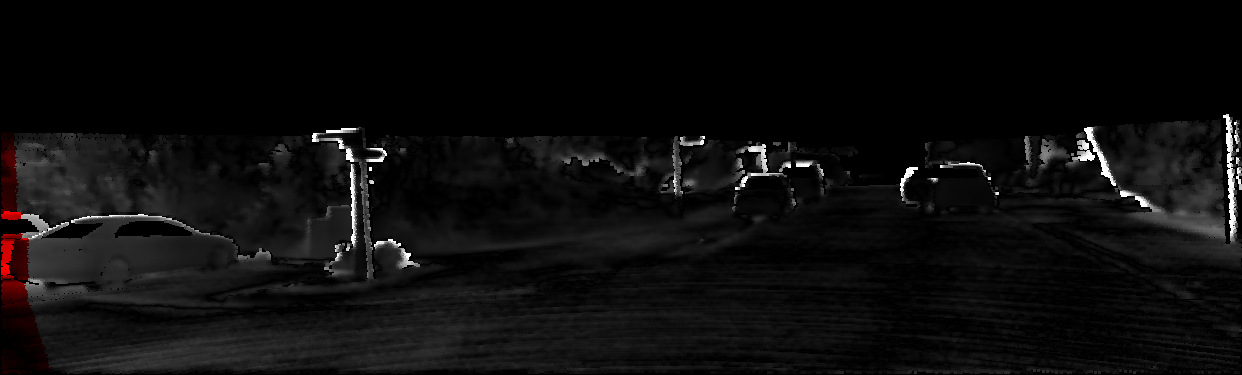
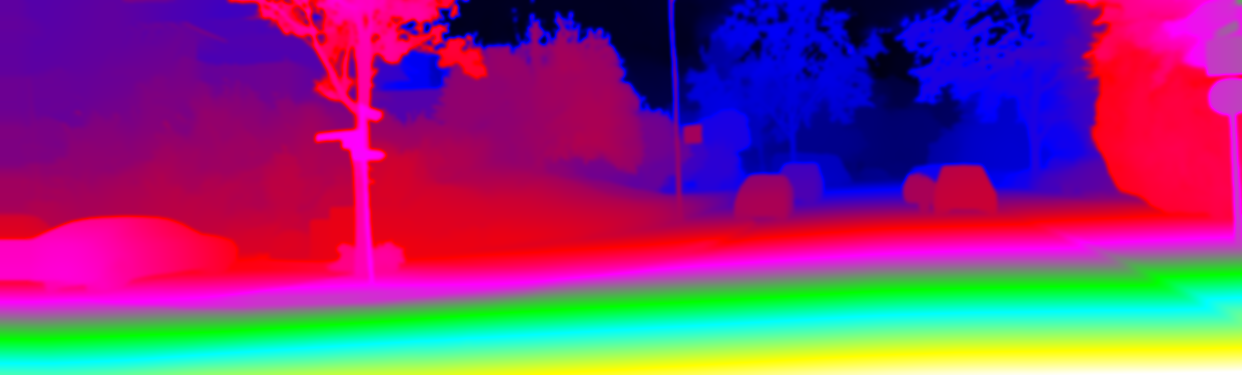
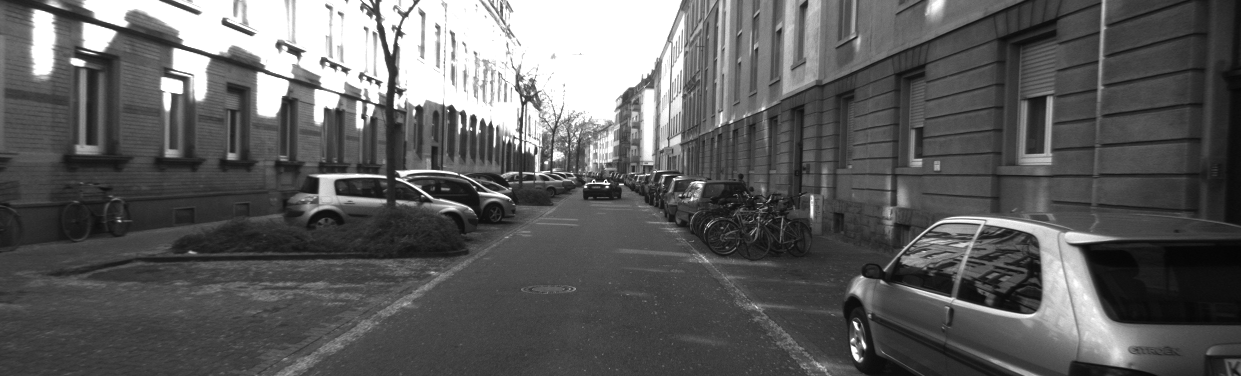
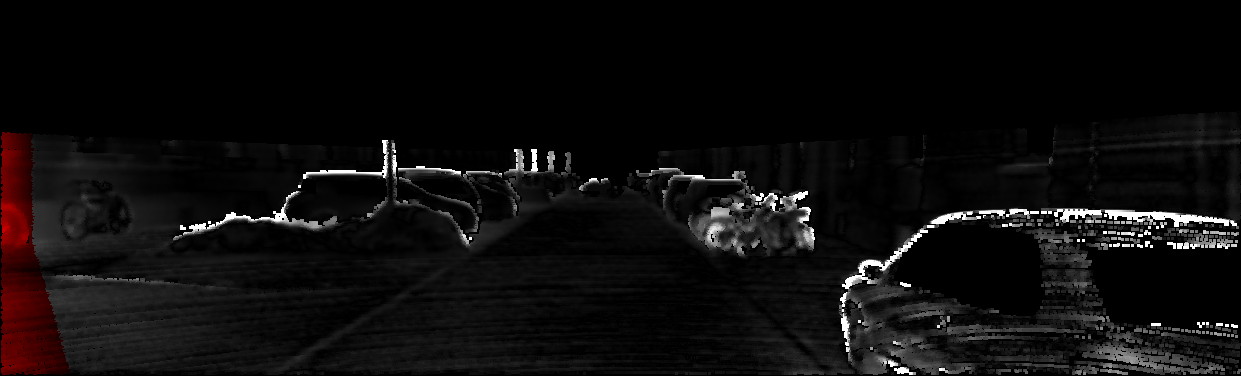
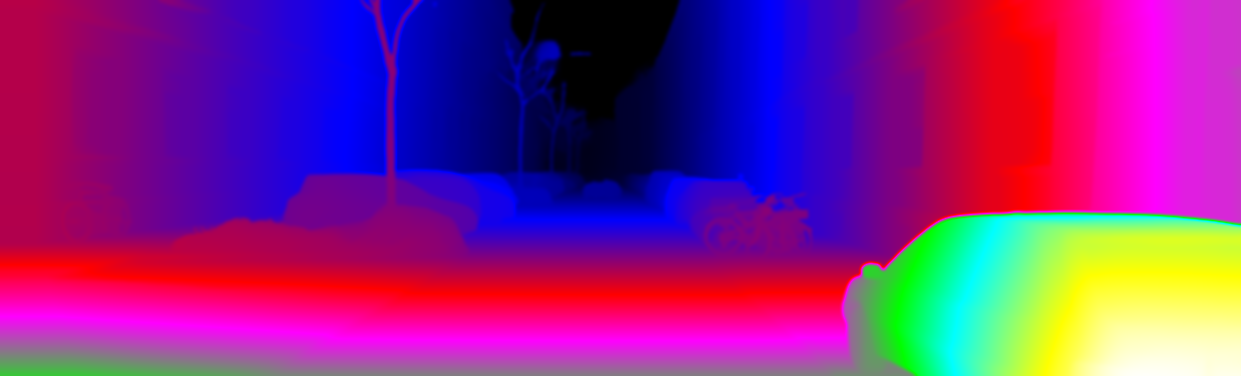
This page provides detailed results for the method(s) selected. For each of the first 20 test images, the number of erroneous pixels at all thresholds is depicted in the table. Underneath, the left input image, the disparity / end-point error map and the estimated (and interpolated) disparity / optical flow map are shown. The error map scales linearly between 0 (black) and >=5 (white) pixels error. Red denotes all occluded pixels, falling outside the image boundaries. The false color map is scaled to the largest ground truth disparity / flow value.


Test Set Average

Error Out-Noc Out-All Avg-Noc Avg-All
2 pixels 4.46 % 5.63 % 0.6 px 0.7 px
3 pixels 3.01 % 3.89 % 0.6 px 0.7 px
4 pixels 2.25 % 2.95 % 0.6 px 0.7 px
5 pixels 1.77 % 2.33 % 0.6 px 0.7 px
This table as LaTeX

Reflective Regions

Error Out-Noc Out-All Avg-Noc Avg-All
2 pixels 8.62 % 12.00 % 0.9 px 1.3 px
3 pixels 4.61 % 7.72 % 0.9 px 1.3 px
4 pixels 3.12 % 5.92 % 0.9 px 1.3 px
5 pixels 2.29 % 4.86 % 0.9 px 1.3 px
This table as LaTeX

Test Image 0

Error Out-Noc Out-All Avg-Noc Avg-All
2 pixels 2.90 % 4.53 % 0.5 px 0.5 px
3 pixels 2.00 % 3.13 % 0.5 px 0.5 px
4 pixels 1.51 % 2.33 % 0.5 px 0.5 px
5 pixels 1.17 % 1.73 % 0.5 px 0.5 px
This table as LaTeX


Test Image 1

Error Out-Noc Out-All Avg-Noc Avg-All
2 pixels 6.10 % 8.47 % 0.7 px 0.8 px
3 pixels 4.41 % 6.09 % 0.7 px 0.8 px
4 pixels 3.43 % 4.55 % 0.7 px 0.8 px
5 pixels 2.76 % 3.43 % 0.7 px 0.8 px
This table as LaTeX


Test Image 2

Error Out-Noc Out-All Avg-Noc Avg-All
2 pixels 3.39 % 4.49 % 0.5 px 0.6 px
3 pixels 2.44 % 2.95 % 0.5 px 0.6 px
4 pixels 1.91 % 2.28 % 0.5 px 0.6 px
5 pixels 1.51 % 1.78 % 0.5 px 0.6 px
This table as LaTeX


Test Image 3

Error Out-Noc Out-All Avg-Noc Avg-All
2 pixels 1.65 % 4.00 % 0.4 px 0.5 px
3 pixels 0.97 % 2.79 % 0.4 px 0.5 px
4 pixels 0.75 % 2.12 % 0.4 px 0.5 px
5 pixels 0.60 % 1.63 % 0.4 px 0.5 px
This table as LaTeX


Test Image 4

Error Out-Noc Out-All Avg-Noc Avg-All
2 pixels 1.55 % 1.86 % 0.4 px 0.4 px
3 pixels 0.88 % 1.02 % 0.4 px 0.4 px
4 pixels 0.56 % 0.69 % 0.4 px 0.4 px
5 pixels 0.43 % 0.55 % 0.4 px 0.4 px
This table as LaTeX


Test Image 5

Error Out-Noc Out-All Avg-Noc Avg-All
2 pixels 3.06 % 3.24 % 0.5 px 0.5 px
3 pixels 2.11 % 2.24 % 0.5 px 0.5 px
4 pixels 1.60 % 1.69 % 0.5 px 0.5 px
5 pixels 1.26 % 1.33 % 0.5 px 0.5 px
This table as LaTeX


Test Image 6

Error Out-Noc Out-All Avg-Noc Avg-All
2 pixels 6.55 % 8.57 % 0.8 px 0.9 px
3 pixels 4.10 % 4.62 % 0.8 px 0.9 px
4 pixels 3.17 % 3.63 % 0.8 px 0.9 px
5 pixels 2.65 % 3.08 % 0.8 px 0.9 px
This table as LaTeX


Test Image 7

Error Out-Noc Out-All Avg-Noc Avg-All
2 pixels 3.94 % 5.88 % 0.7 px 0.9 px
3 pixels 2.86 % 4.46 % 0.7 px 0.9 px
4 pixels 2.27 % 3.49 % 0.7 px 0.9 px
5 pixels 1.97 % 2.94 % 0.7 px 0.9 px
This table as LaTeX


Test Image 8

Error Out-Noc Out-All Avg-Noc Avg-All
2 pixels 4.31 % 4.77 % 0.6 px 0.6 px
3 pixels 2.86 % 3.12 % 0.6 px 0.6 px
4 pixels 1.98 % 2.10 % 0.6 px 0.6 px
5 pixels 1.55 % 1.65 % 0.6 px 0.6 px
This table as LaTeX


Test Image 9

Error Out-Noc Out-All Avg-Noc Avg-All
2 pixels 3.16 % 4.99 % 0.6 px 0.8 px
3 pixels 2.22 % 3.87 % 0.6 px 0.8 px
4 pixels 1.83 % 3.23 % 0.6 px 0.8 px
5 pixels 1.59 % 2.57 % 0.6 px 0.8 px
This table as LaTeX


Test Image 10

Error Out-Noc Out-All Avg-Noc Avg-All
2 pixels 3.51 % 4.72 % 0.5 px 0.6 px
3 pixels 2.03 % 2.95 % 0.5 px 0.6 px
4 pixels 1.26 % 1.92 % 0.5 px 0.6 px
5 pixels 0.88 % 1.32 % 0.5 px 0.6 px
This table as LaTeX


Test Image 11

Error Out-Noc Out-All Avg-Noc Avg-All
2 pixels 5.27 % 8.40 % 0.8 px 0.9 px
3 pixels 3.24 % 5.86 % 0.8 px 0.9 px
4 pixels 2.36 % 4.40 % 0.8 px 0.9 px
5 pixels 1.86 % 3.34 % 0.8 px 0.9 px
This table as LaTeX


Test Image 12

Error Out-Noc Out-All Avg-Noc Avg-All
2 pixels 7.05 % 8.76 % 1.1 px 1.2 px
3 pixels 5.61 % 7.05 % 1.1 px 1.2 px
4 pixels 4.69 % 5.92 % 1.1 px 1.2 px
5 pixels 4.08 % 5.05 % 1.1 px 1.2 px
This table as LaTeX


Test Image 13

Error Out-Noc Out-All Avg-Noc Avg-All
2 pixels 5.88 % 6.82 % 0.8 px 0.9 px
3 pixels 4.40 % 5.22 % 0.8 px 0.9 px
4 pixels 3.53 % 4.22 % 0.8 px 0.9 px
5 pixels 2.99 % 3.57 % 0.8 px 0.9 px
This table as LaTeX


Test Image 14

Error Out-Noc Out-All Avg-Noc Avg-All
2 pixels 1.64 % 2.04 % 0.4 px 0.4 px
3 pixels 1.16 % 1.14 % 0.4 px 0.4 px
4 pixels 0.89 % 0.87 % 0.4 px 0.4 px
5 pixels 0.67 % 0.65 % 0.4 px 0.4 px
This table as LaTeX


Test Image 15

Error Out-Noc Out-All Avg-Noc Avg-All
2 pixels 5.41 % 5.69 % 0.7 px 0.7 px
3 pixels 3.63 % 3.61 % 0.7 px 0.7 px
4 pixels 2.56 % 2.49 % 0.7 px 0.7 px
5 pixels 1.99 % 1.94 % 0.7 px 0.7 px
This table as LaTeX


Test Image 16

Error Out-Noc Out-All Avg-Noc Avg-All
2 pixels 7.03 % 6.90 % 0.7 px 0.7 px
3 pixels 3.22 % 3.16 % 0.7 px 0.7 px
4 pixels 1.71 % 1.68 % 0.7 px 0.7 px
5 pixels 0.98 % 0.96 % 0.7 px 0.7 px
This table as LaTeX


Test Image 17

Error Out-Noc Out-All Avg-Noc Avg-All
2 pixels 5.91 % 6.81 % 0.7 px 0.8 px
3 pixels 4.20 % 4.60 % 0.7 px 0.8 px
4 pixels 3.19 % 3.52 % 0.7 px 0.8 px
5 pixels 2.49 % 2.76 % 0.7 px 0.8 px
This table as LaTeX


Test Image 18

Error Out-Noc Out-All Avg-Noc Avg-All
2 pixels 1.23 % 1.38 % 0.4 px 0.4 px
3 pixels 0.79 % 0.88 % 0.4 px 0.4 px
4 pixels 0.54 % 0.60 % 0.4 px 0.4 px
5 pixels 0.34 % 0.34 % 0.4 px 0.4 px
This table as LaTeX


Test Image 19

Error Out-Noc Out-All Avg-Noc Avg-All
2 pixels 2.40 % 2.94 % 0.4 px 0.5 px
3 pixels 1.53 % 1.54 % 0.4 px 0.5 px
4 pixels 1.06 % 1.03 % 0.4 px 0.5 px
5 pixels 0.82 % 0.79 % 0.4 px 0.5 px
This table as LaTeX


eXTReMe Tracker