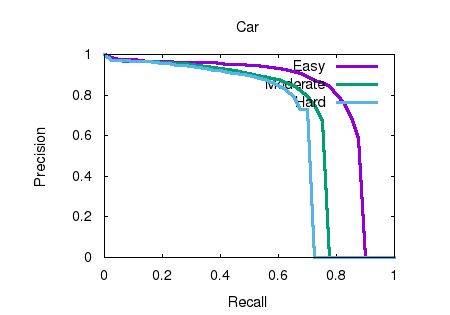
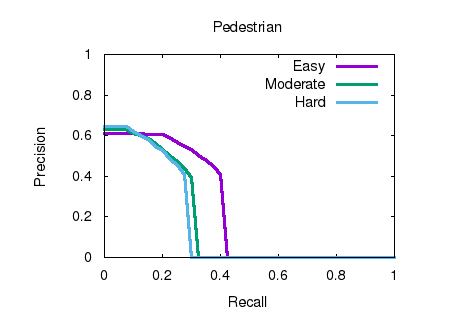
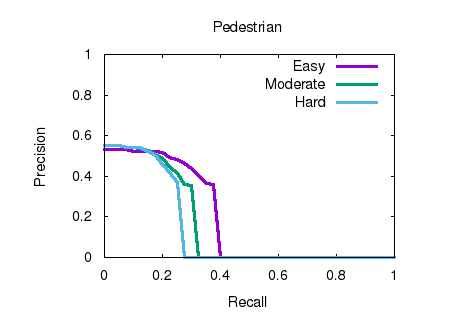
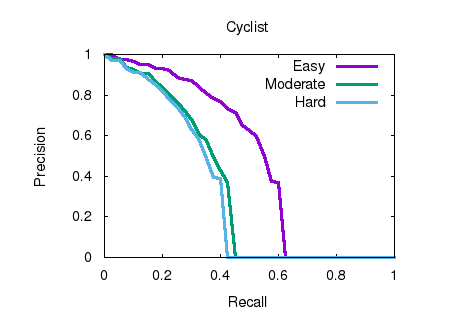
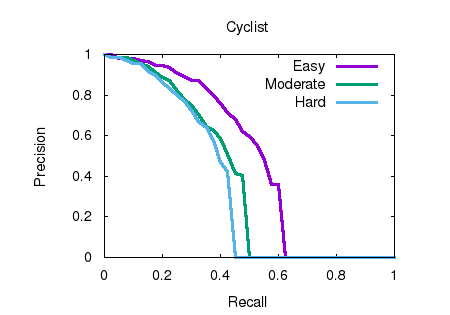
We follow the object detection task described in
our previous paper. However, here we use a
RetinaNet variant with separable convolutions, less
pooling, deconvolutional upsampling, a mask to
filter anchors based on the sparse grid map
structure and a class-dependent matching threshold. |
Separable convolutions, reduced pooling, deconv.
upsampling, mask for sparse input representation
filtering, class-dependent matching threshold |
@INPROCEEDINGS{8569433,
author={S. Wirges and T. Fischer and C. Stiller
and J. B. Frias},
booktitle={2018 21st International Conference on
Intelligent Transportation Systems (ITSC)},
title={Object Detection and Classification in
Occupancy Grid Maps Using Deep Convolutional
Networks},
year={2018},
volume={},
number={},
pages={3530-3535},
abstract={Detailed environment perception is a
crucial component of automated vehicles. However,
to deal with the amount of perceived information,
we also require segmentation strategies. Based on
a grid map environment representation, well-
suited for sensor fusion, free-space estimation
and machine learning, we detect and classify
objects using deep convolutional neural networks.
As input for our networks we use a multi-layer
grid map efficiently encoding 3D range sensor
information. The inference output consists of a
list of rotated bounding boxes with associated
semantic classes. We conduct extensive ablation
studies, highlight important design
considerations when using grid maps and evaluate
our models on the KITTI Bird's Eye View
benchmark. Qualitative and quantitative benchmark
results show that we achieve robust detection and
state of the art accuracy solely using top-view
grid maps from range sensor data.},
keywords={feedforward neural nets;image
classification;image segmentation;learning
(artificial intelligence);mobile robots;object
detection;robot vision;sensor fusion;occupancy
grid maps;deep convolutional networks;detailed
environment perception;crucial
component;automated vehicles;perceived
information;segmentation strategies;grid map
environment representation;sensor fusion;free-
space estimation;machine learning;classify
objects;deep convolutional neural
networks;multilayer grid map;3D range sensor
information;inference output;rotated bounding
boxes;associated semantic classes;extensive
ablation studies;highlight important design
considerations;qualitative benchmark
results;quantitative benchmark results;robust
detection;top-view grid maps;range sensor
data;KITTI birds eye view benchmark;Feature
extraction;Object
detection;Cameras;Training;Encoding;Three-
dimensional displays;Semantics},
doi={10.1109/ITSC.2018.8569433},
ISSN={2153-0017},
month={Nov},
url={http://arxiv.org/abs/1805.08689},} |


